


Reporting Software – Report Examples and Dashboard Examples for Industrial Applications
Welcome to the Dream Report “Report examples, Dashboard examples and Templates” Gallery. This is a view of some the many reports and dashboards that are possible with Dream Report. Most reports and dashboards are included with the product demonstration project. Others are available from third parties. See each description for details about the report and how to get more information.
Reports can take many forms. Dream Report will generate PDF Files, Microsoft Excel Files (.xls and xlsx), Comma Separated Variables (.csv) and can log to relational databases.
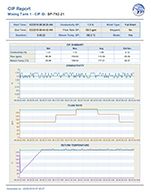
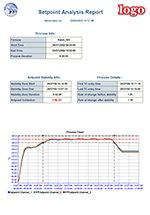
Clean In Place CIP, Sterilize In Place , Wash In Place (WIP), Standard Operating Procedures (SOP) Reports
Many food, pharmaceutical and biotech applications run as batch applications. Between batches, Standard Operating Procedures dictate how Clean in Place, Sterilize in Place and Wash in Place processes are performed and these processes have documentation requirements. Dream Report is commonly used to generate CIP, SIP, WIP Reports and Dashboards to monitor the process. These reports rely heavily on automated operation and the ability to recognize the start and end of the process with the DBATCH option in Dream Report.
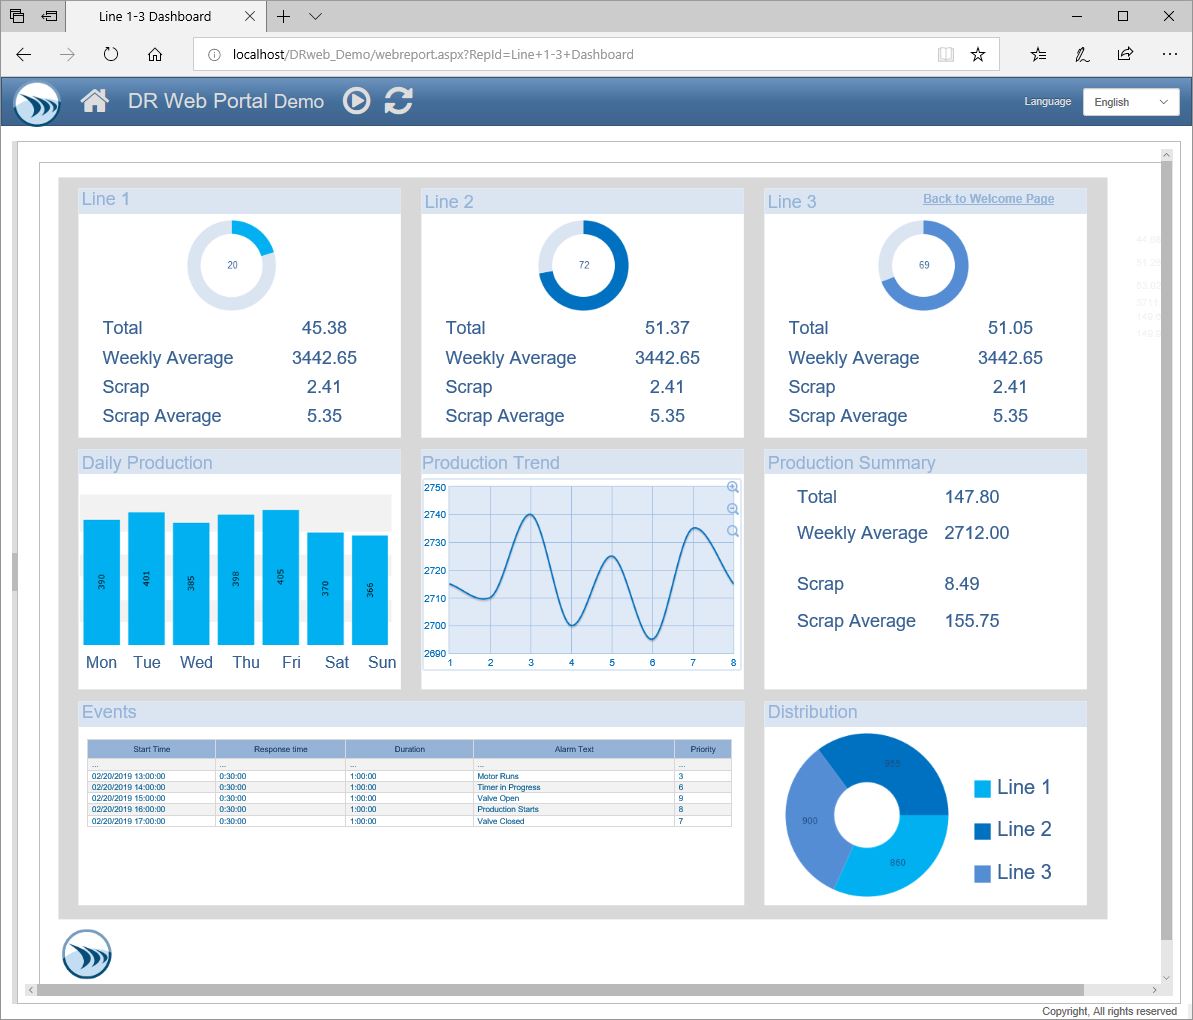
Real-time Dashboards, Production Dashboards, Downtime Dashboards
View your data anywhere and anytime. The Dream Report browser based portal will let you access your information from PCs and Mobile devices using any browser; Internet Explorer, Edge, Chrome, Firefox and Safari. Fully HTML5 based, supports login security and has been tested by the Department of Homeland Security ( https://ics-cert.us-cert.gov/ ). The portal is usually used on your internal network (internet not required).
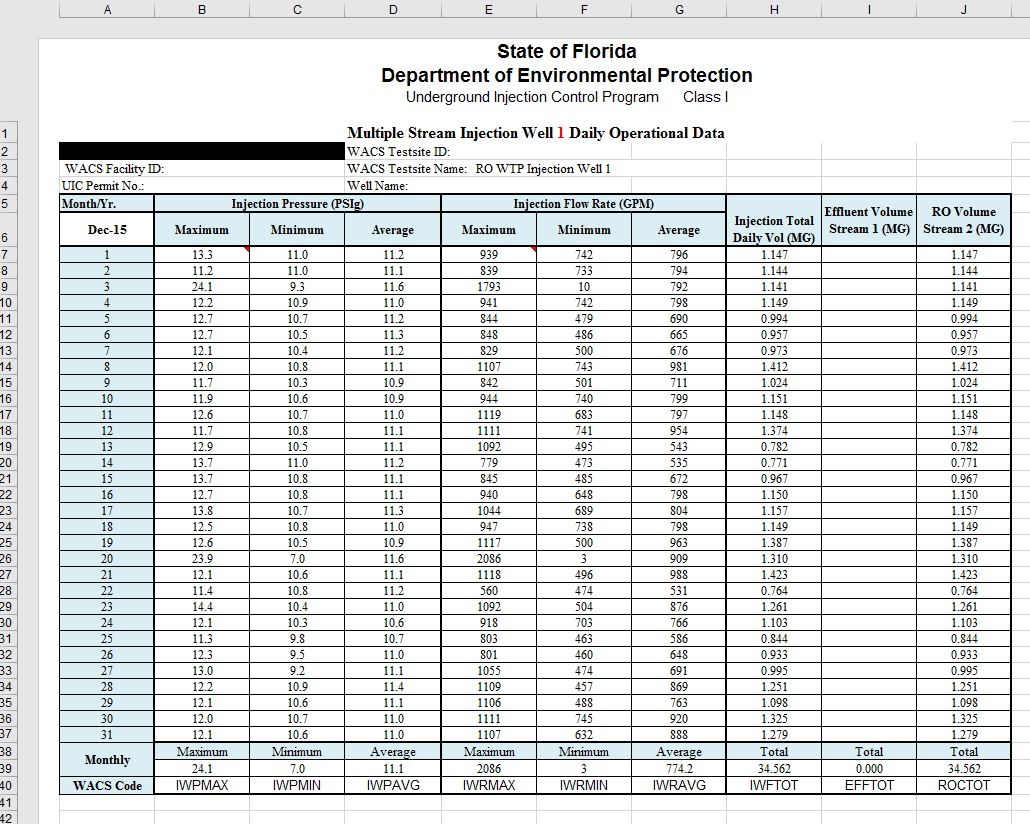
Water Treatment Injection Well Report from Reverse Osmosis System (RO)
Many EPA Reports are generated in Excel Workbook formats. In fact, in many cases, the State will have a Template Workbook that they request water plant operators to fill in. This is a sample workbook that Dream Report automatically fills in. Dream Report selects the template, performs the calculations and places the results in the cells, rows and columns that you specify, then saving the result for approval and delivery.
Water System Pump Status and Tank Levels
Managing your water pumps and tank storage is easy with Dream Report. It will make quick work of calculating run-times, monitoring states of equipment and displaying the results in any form that you would like.
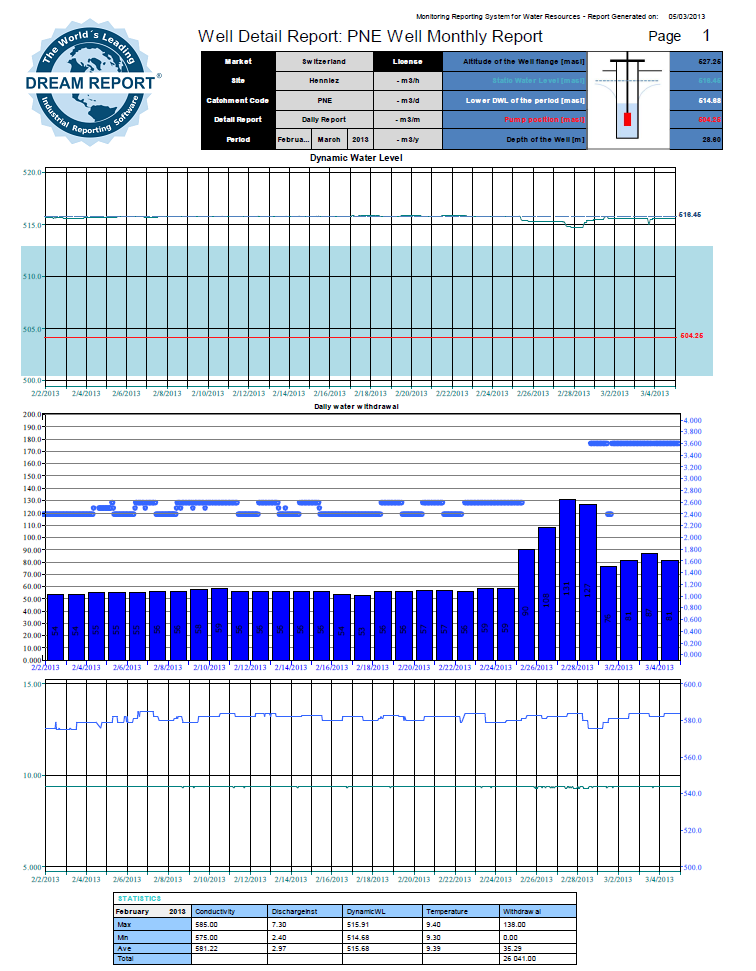
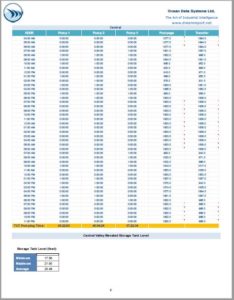
Monthly Report of Daily Well Water Draw and Pump Operations
This report example shows the monthly report of daily water use from a well. Tables of statistics are quick and easy to create. Reports may be archived to a directory of your choice and transferred via FTP or Email to others in your business.
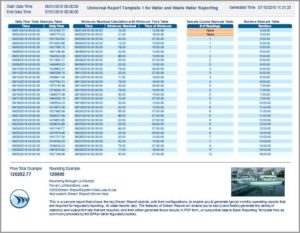
Water and Waste Water Report Templates
Water and Waste Water Reports all look different, but they all have similar calculations – Flow Totals, Minimums, Maximums, Duration Calculations, Number of Excursions, etc. Dream Report delivers a number of report templates showing how easy it is to create your specific report with canned calculations in Dream Report.

RTU Monitoring and Lift Station Monitoring
RACO is a manufacturer of RTU products for monitoring Water and Waste Water Pump Stations and Lift Stations. They offer a Cloud based solution for accessing and reviewing the data from their RTUs. Their user interface is based on Dream Report.
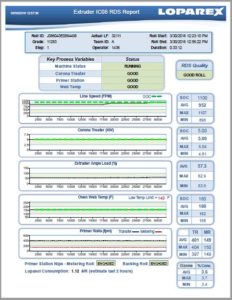
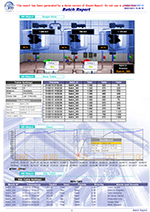
Paper Converting Application – Roll Report
Batches can take many forms, in this case, a large roll of release liner used for label stock. Dream Report is generating the pass fail reports in a paper converting application. Each report offers the Roll Serial Number, the charting of Key Performance Indicators (KPIs) and the final Pass/Fail.
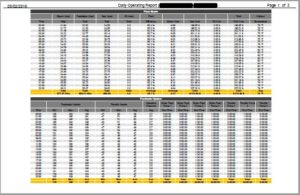
Boiler Operations Report – Boiler Status Report
Boiler efficiency monitoring and boiler cost accounting is an application Dream Report is well suited for. In this application, Dream Report generates Daily and Shift reports on boiler operations, fuels used and overall cost to operate.
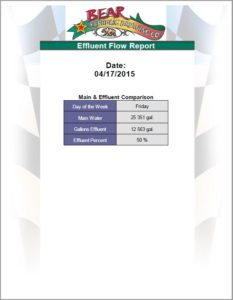
Main Effluent Report to the City – Bear Republic Brewing
California experienced one of the worst droughts of modern times between 2011 and 2017. Bear Republic Brewing needs water to make Beer. These clashing conditions required Bear Republic Brewing to install Dream Report for two reasons, first to track and reduce internal water consumption and second, to automatically email this report to the city, every day, on how much water they used.
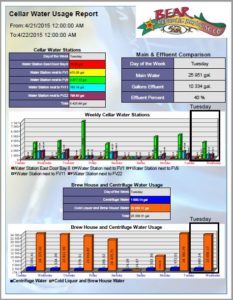
Internal Water Allocation – Bear Republic Brewing
California experienced one of the worst droughts of modern times between 2011 and 2017. Bear Republic Brewing needs water to make Beer. These clashing conditions required Bear Republic Brewing to install Dream Report for two reasons, first to track and reduce internal water consumption by automatically generating this report, and second, to automatically email water use to the city, every day.
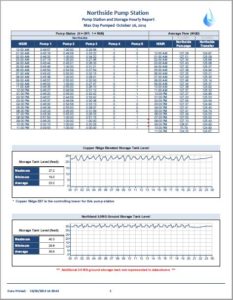
Pump Station Report – Water Pump Report
Dream Report is used in a wide variety of equipment monitoring applications. Pumps are valuable assets in a water system and Dream Report can calculate Pump Run-times, Pump Efficiency and Pump Maintenance Schedules. Dream Report can also report from your asset management systems, combining all data into one report or dashboard.
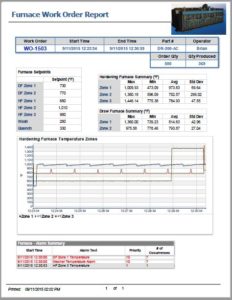
Furnace Work Order Report – Temperature Uniformity Survey
Heat Treat Monitoring is a common application for Dream Report. Some industries require certification and Temperature Uniformity Testing on a regular basis. Dream Report offers specialized functionality for AMS2750 and other specifications.
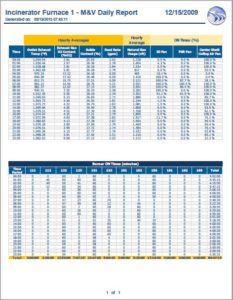
Incinerator Operations Report – Fuel Use, Oxygen (O2) Flue Gas Levels
Incinerators require continuous monitoring for emissions, operational conditions such as fuel use, temperatures, feed rates, Fan Status among other things. These are easy applications for Dream Report with its ability to acquire industrial data from any source and perform the right calculations with minimal effort.
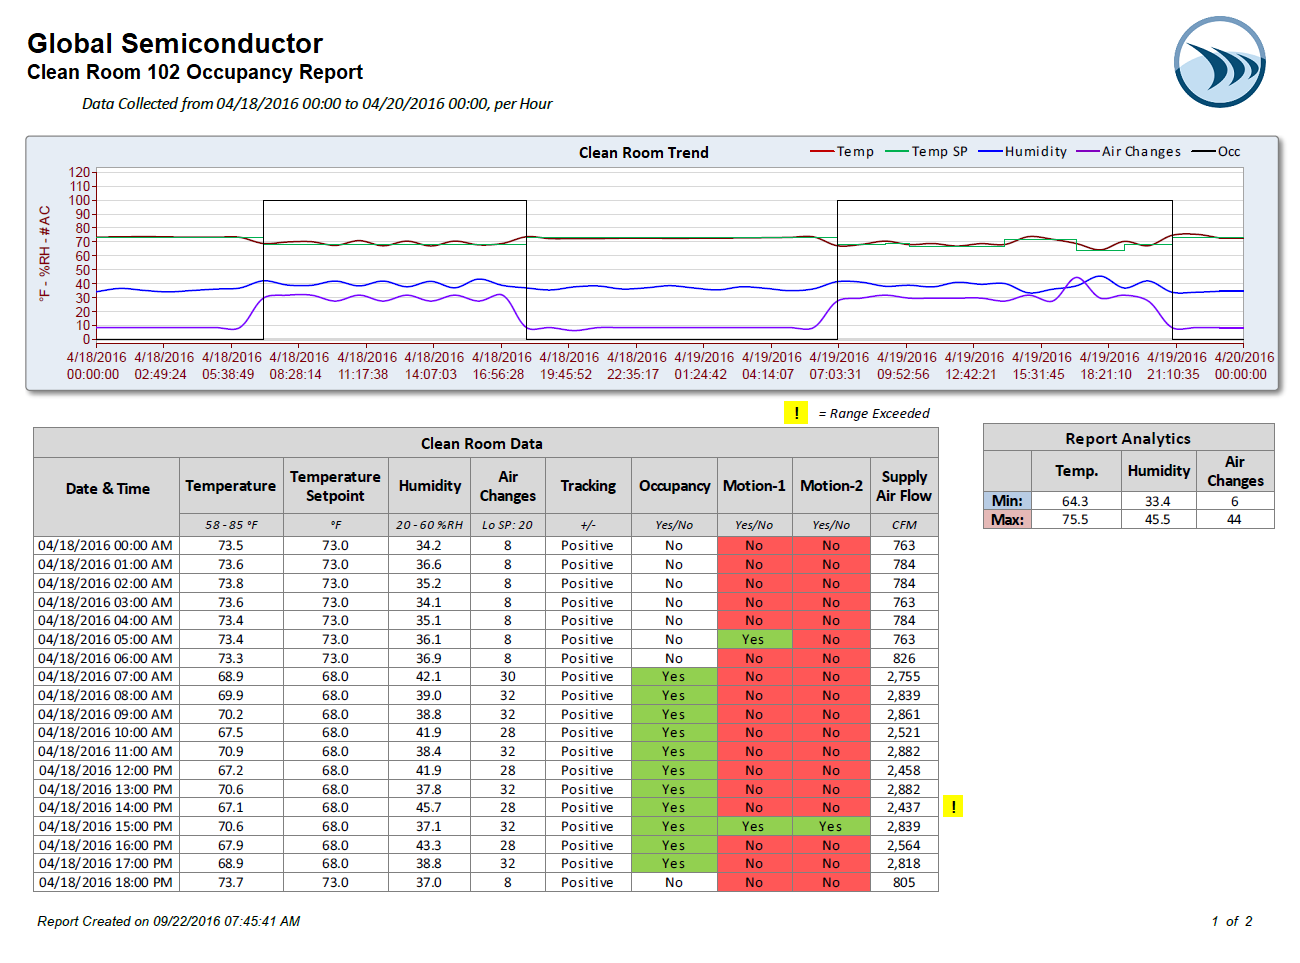
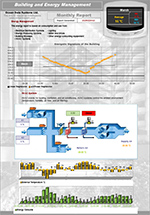
Semiconductor Facility Building Monitoring System (BMS)
Certain manufacturing applications require close monitoring of facility air quality and HVAC Systems. In this sample report, we are looking at Clean Room Temperature, Humidity, Occupancy, Air Changes and other variables.
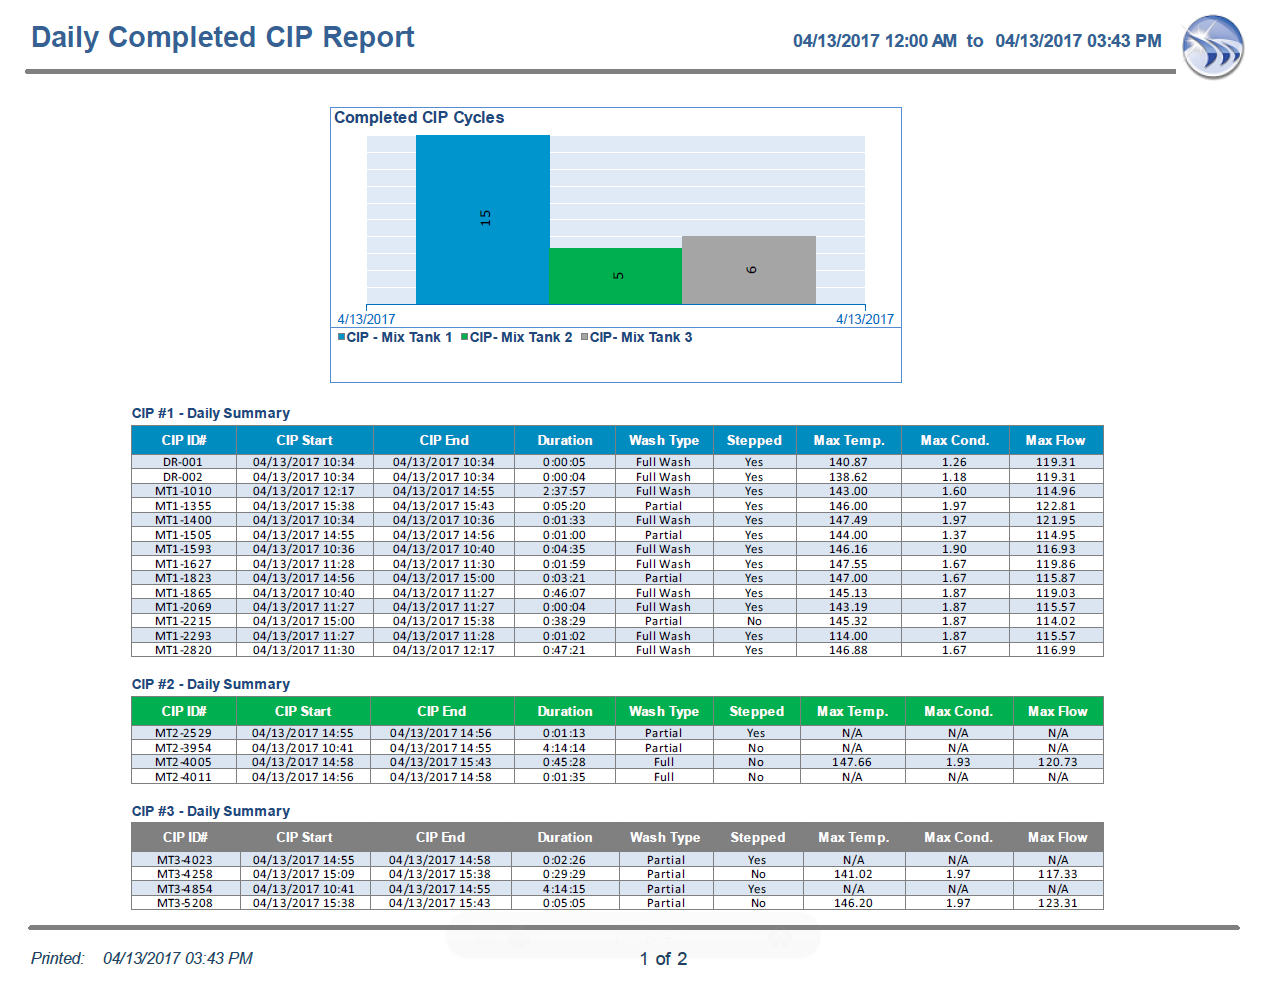
Clean In Place, Wash In Place, Sterilize in Place Reports and Dashboards
Batch applications typically need clean in place operations. Food, Pharmaceutical and Biotech applications need more monitoring and reporting for quality purposes, including the sterilizing of equipment between batches. This is an area where Dream Report goes above and beyond, delivering functionality to monitor batch operations with the DBATCH Option, and offering support for 21 CFR Part 11, regulations requiring security, audit trails and electronic signatures.
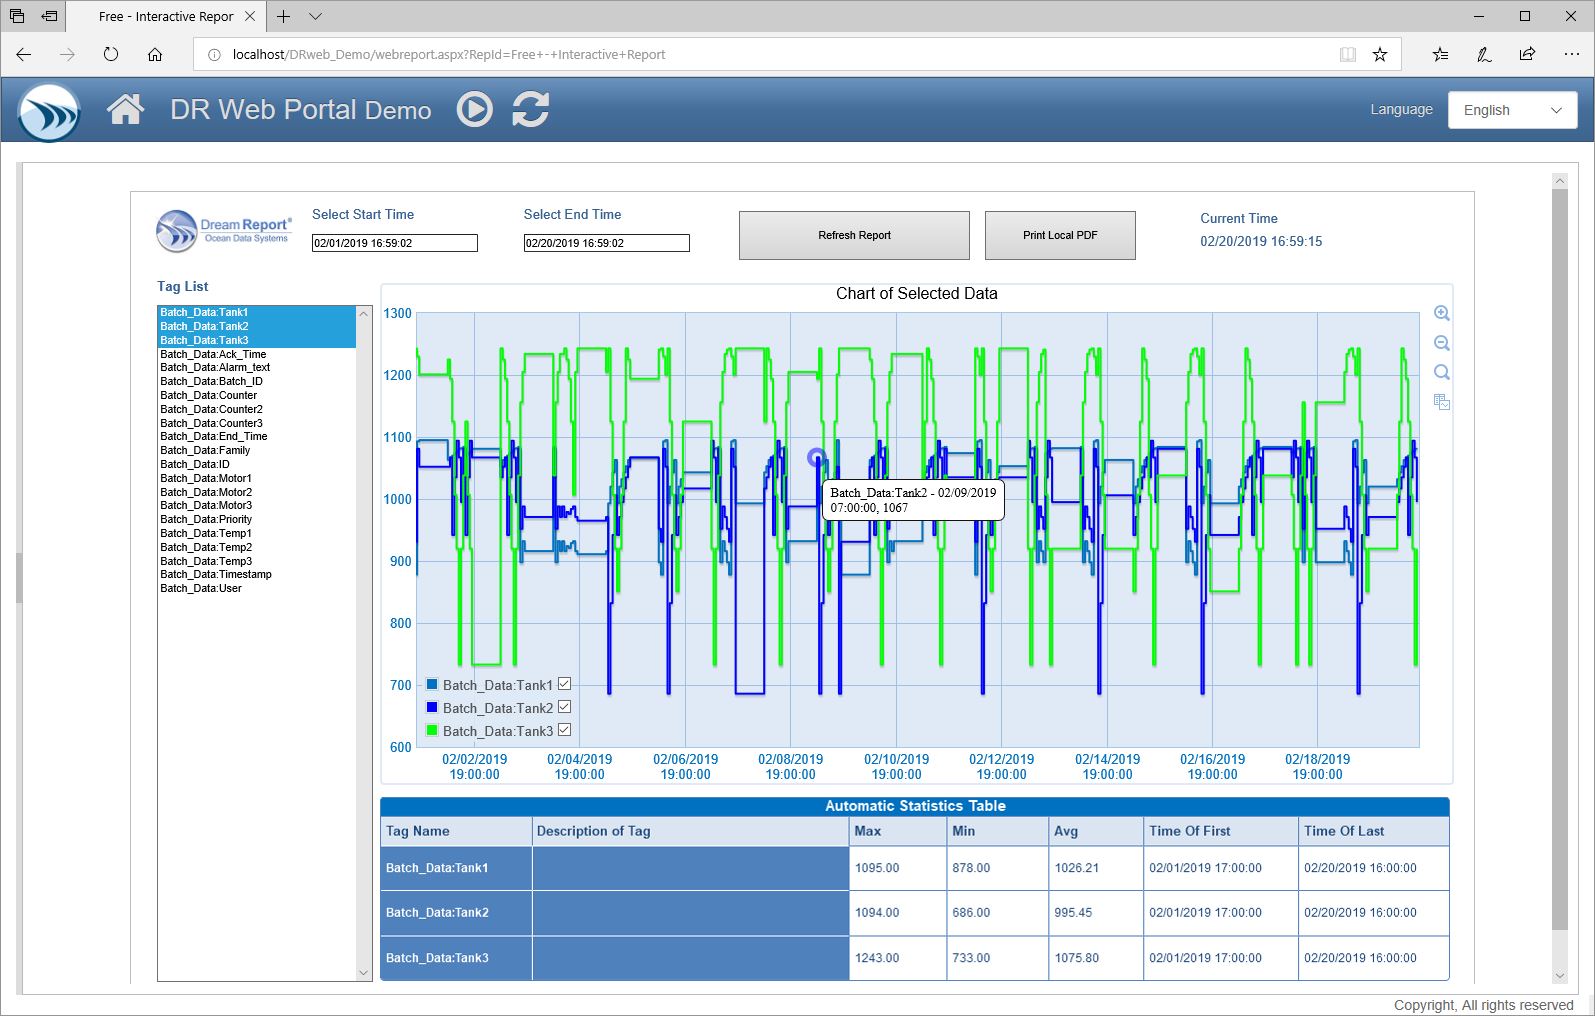
Ad-hoc Analysis, Review Your Data, Pan – Zoom – Export
Every information system should offers ways to explore and validate your data. The Dream Report portal lets you do just that by building a Web Report similar to this one. Takes about 15 minutes and you are ready to browse tags at any time, select dates and times of interest, graph the results, generate summary statistics, pan/zoom and export your results to other systems or simply Excel.
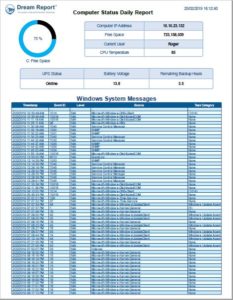
Monitoring Your IT Infrastructure with SNMP, SYSMON and Log Files
Your infrastructure is critical to managing the performance and reliability of your automation system. Monitoring that is equally as important as important as monitoring your processes. Dream Report makes that easy.
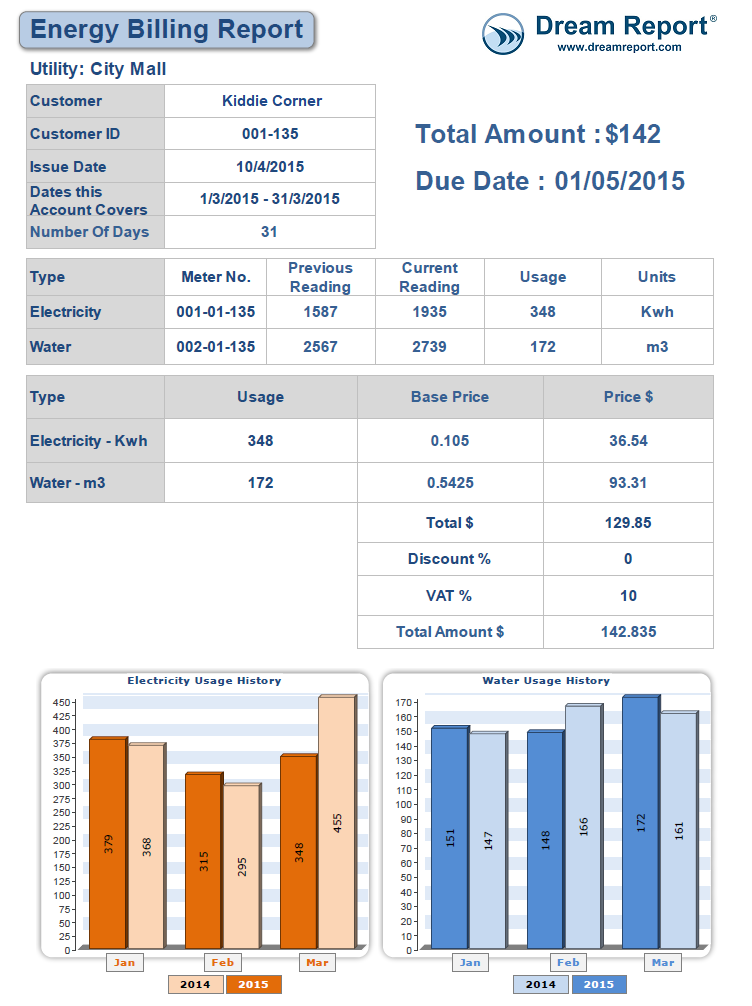
Utility Reports for Large Complexes, Factories, Malls
The distribution of costs for large organizations can be challenging. The automated reading of meters, calculations of totals, allocation of charges, etc. can be a time consuming chore. Dream Report can do all that for you automatically and without effort on your part. Even the distribution of invoices.
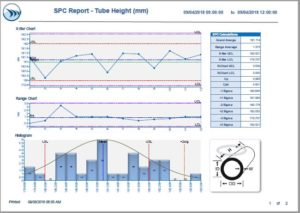
Statistical Process Control (SPC) – SPC Reports and Dashboards
Statistical Process Control and Statistical Process Reporting is delivered through the Dream Report SPC Option. This option delivers SPC Calculations and SPC Charts for both Discrete Sample and Time-based Sampling. The Nelson Rules are applied for SPC result testing are supported to highlight anomaly conditions.
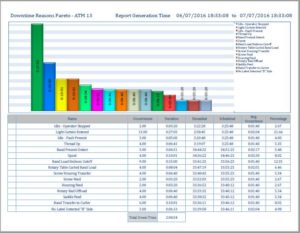
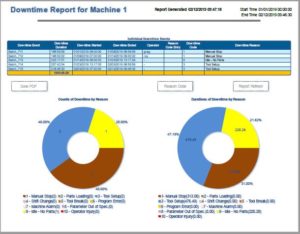
Downtime Reason Report – Pareto Report on Downtime Reasons
This is a typical downtime reasons report and analysis. Dream Report can automatically or manually collect downtime events and reasons, and then aggregate them by reason and totalize downtime percentages and times for each.
Machine Downtime Monitoring and Downtime Tracking Reports
Downtime Tracking involved monitoring a machine or process, identifying periods of downtime, and then identifying reasons for each downtime event, either automatically or manually. Dream Report offers purpose built functionality for downtime monitoring. The DBATCH option can capture downtime events and reasons, and Manual Data Entry features enable the operator entry if downtime reasons are not available automatically.
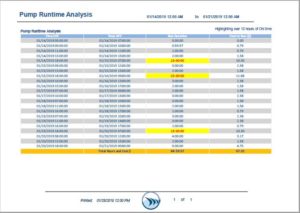
Pump Run-time Report with Cost Analysis
Knowing the status of your equipment and the cost to operate your equipment lets you plan for the future, plan maintenance, and drive continuous improvement. Dream Report can monitor any and all of your major assets and will report on their operation and cost.
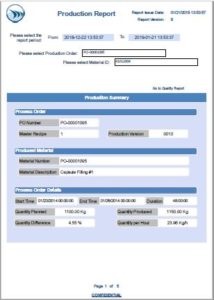
Production Reporting and Reporting on Specific Lots and Work Orders
You need to report on the dates and times of production, the lot codes, the material IDs and much more. Dream Report can easily pull that together for you through the interactive browser based portal. Make your selections and press a button to generate a report or dashboard.
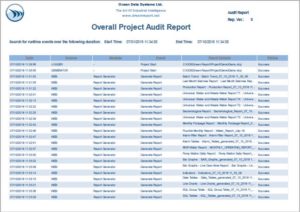
Audit Trail Report – Often Supporting 21 CFR Part 11 in Life Sciences, Pharma and Biotech
21 CFR Part 11 requires an audit trail of changes to your information system. Dream Report supports this audit trail requirement and the need for excellent security, version management and electronic signature.
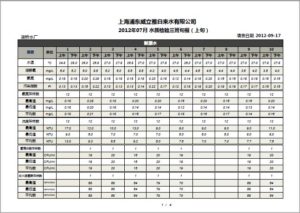
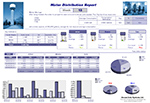
Water Treatment Report
Dream Report is available all around the world and is available in 14 Languages. This is a water report from one of our customers in China.
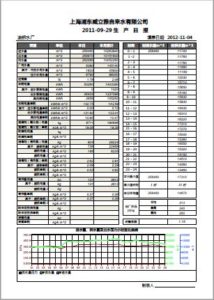
Water Treatment Report
Dream Report is available all around the world and is available in 14 Languages. This is a water report from one of our customers in China.
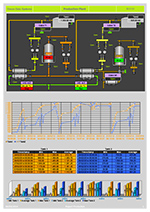
Chemical Plant Production Status Report
This Demo Report shows an overview of a chemical process with shapshot status information along with a chart and summaries over the past week. Production reports can deliver information through graphics, trends, bar charts and many more objects. Reports should present the information in the ways that enable your teams to best interpret the results and drive continuous improvement.
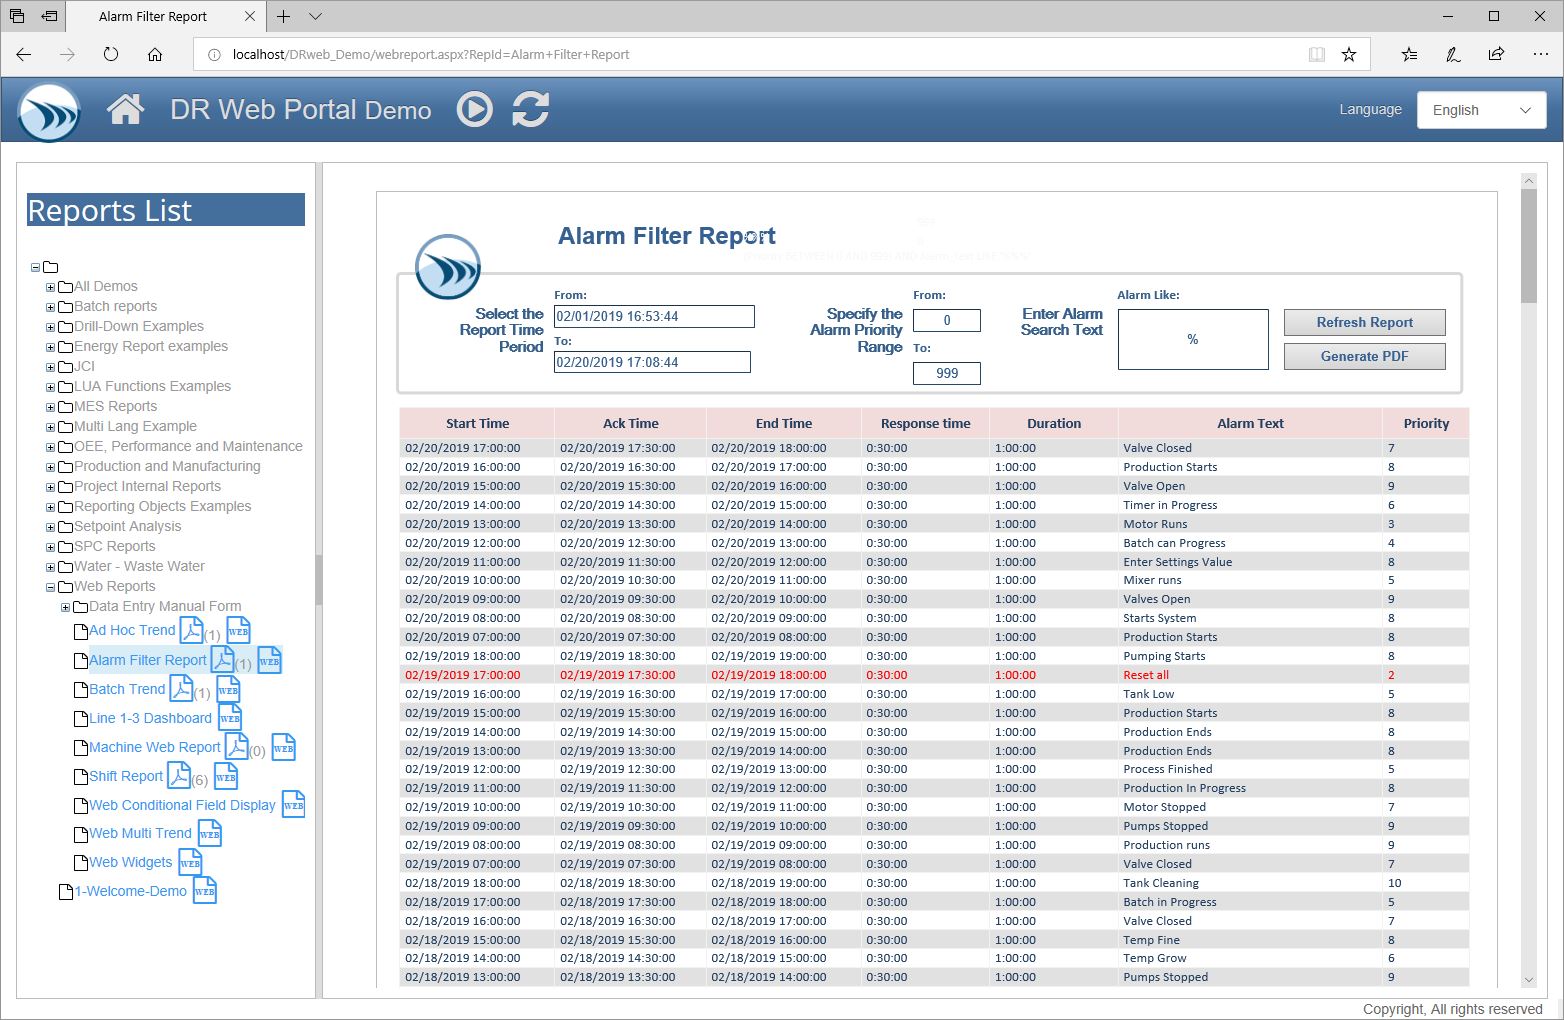
Interactive Alarm Analysis through a Browser Based Portal
Alarm Analysis is important in all applications, but it is especially important in some industries such as Oil and Gas, Chemicals, and Power. In these industries, alarms can be plentiful and analyzing your alarms, quickly and easily is a job for Dream Report, especially if you are following ISA 18.2 Guidelines.

Change Request Form, for Managing Larger Applications
Larger applications will typically have Dream Report users and Dream Report administrators. Take a few minutes and build a simple Change Request Form to let users request changes or enhancements to reports and dashboards in your Dream Report application.
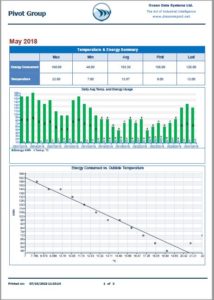
Pivot Group or Step Group of Objects for Reporting
Just as a Step Table can query a large data set and analyze that over steps (Rows) in a Table, the Dream Report Pivot Group can query a large set of data and replicate a grouped set of objects to give you a stepped result. This example report shows a Pivot Group of data, charts and bar graphs.
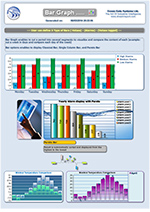
Bar Graph Report and Dashboard Object
The Dream Report Bar Graph Object is very configurable. This report example shows clustered bars, individual bars, Pareto bars, and stacked bars. Reports can have title areas, dates, times, page numbers, colored and image backgrounds.
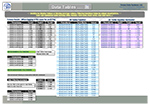
Step Tables, Data Tables – Report and Dashboard Object
One major strength of Dream Report is to present results in Tables. Tables may present queried data or may aggregate that data as you desire. Step Tables will query a large amount of data and summarize it into steps. Examples are Monthly Tables with Daily summaries. Shift Tables with Batch summaries. Tables will automatically expand as necessary, complete with pagination, page numbers, and alternate output formats like .CSV and Excel .XLS and .XLSX.
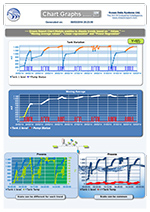
Chart and Trend Object for Reports and Dashboards
The Chart object can display data vs time, data vs data (XY Plot) for dozens of pens. Scales may be fixed or variable. The object, when used in Dashboard offers interactions for pan, zoom and export. This sample report shows some of the many ways a chart may be configured.
Source: Delivered with Dream Report Demo
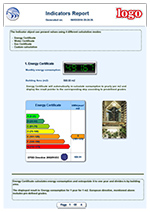
Performance Indicator Report and Dashboard Object
The colorful Performance Indicator is a general purpose object for showing any performance results against a target that also meets European Energy Performance of Buildings Directive or EPBD requirements for displaying energy performance statistics. This is a very flexible object that can be used to display KPI metrics for performance dashboards or energy metrics in reports.
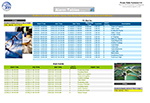
Water Tank Dashboard for Water and Waste Water Markets
A Web Portal, automatically managed by the Dream Report Run-time, gives users access to their reports and dashboards. The portal supports displaying PDF Reports, accessing Excel Reports, and viewing real-time Dashboards. This interface can be used on internal networks, but can also be exposed for Internet access (your choice). This particular display is for a Municipal Water application.
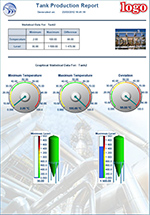
Widgets – Data Display Objects for Reports and Dashboards
Dream Report statistics can be displayed as text values or as graphic objects – Widgets. This report shows textual data as well as data displayed as a Gage and as Bar Charts. Additional Widgets include an LED Digital Display, a Progress Doughnut.
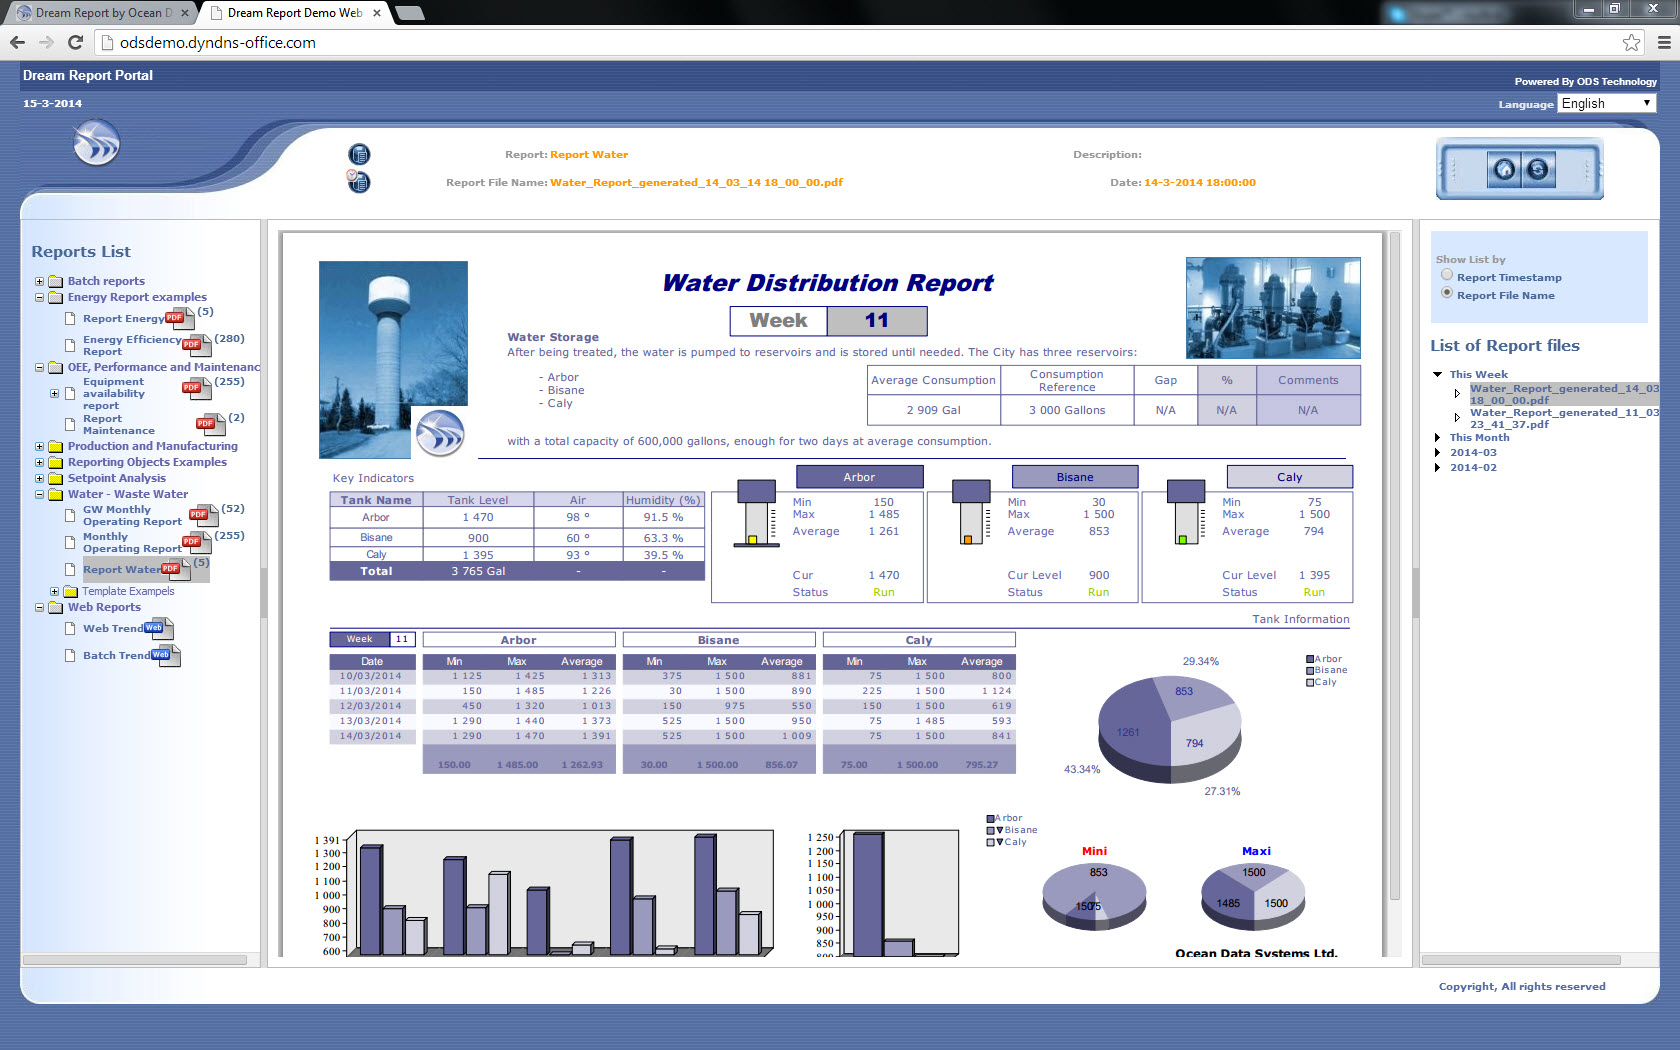
Water Distribution Report
This is an example of a water distribution report for a small municipality. Dream Report is a leading solution for compliance and performance reporting in the water treatment industry. Monthly Operating Reports, Distribution Reports, Status Dashboards, Chemical Usage Reports, Pump Run-time Reports and more.
Temperature Uniformity Survey (TUS) Reports
Dream Report delivers an extremely powerful tool for certifying your thermal processes. There are various standards for heat treat processes. They include AMS 2750E, CQI-9 and NADCAP. AMS 2750 E (Aerospace Material Specifications) is applicable for the industrial processing of high-quality materials. AMS 2750 E and derivative standards such as AMS 2770, for example, are for the heat treatment of aluminum are the guidelines for the aerospace industry. Dream Report meets these reporting requirements.
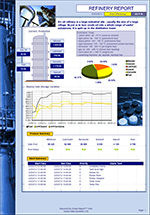
Oil and Gas Industry Reports and Dashboards
Example of a Distillation Column Report in a Refinery. Dream Report can generate any statistics for any application and display the results as you would like to see them in Reports or Dashboards.
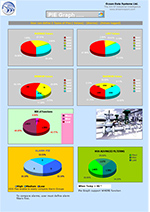
Pie Chart Reporting Object
The PIE Chart Reporting Object is very configurable and can display results in Pie or Doughnut form. Each segment can generate statistics from a raw data source. Pie objects also support Drill-down to raw data. This report displays some of the many visual characteristics.
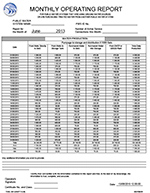
Water Plant Monthly Operating Report (MOR)
Water and Wastewater applications are one of Dream Report’s largest application categories. The Monthly Operating Report is commonly needed to meet either State or Federal compliance reporting requirements. Dream Report can be configured to generate the exact reports needed, or can generate the results you wish for manual submission of data. Formats can include PDF and Excel files.
Building Automation System Component Monitoring and Management
You need to know your BAS systems are operating reliably and with expected performance. Dream Report will calculate the up-time, down-time, run-time, perform year over year analysis and will keep you informed of what you need to react to, automatically.
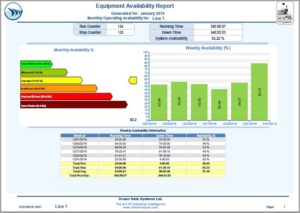
Equipment Performance Monitoring – Availability Report
Are you interested in Overall Equipment Efficiency (OEE)? Up-time, Down-time, Run-time? Need maintenance reports and work-orders delivered automatically? Need a corporate or department dashboard to view all your assets? Dream Report delivers.
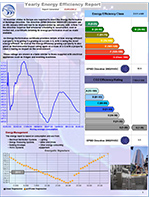
Energy Performance of Buildings Directive (EPBD)
Building Automation System Report for overall performance. Report on Compressor efficiency, Cooling Tower Efficiency, Overall Building Efficiency.
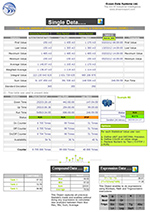
Extracting and Analyzing Automation Data in Tabular Reports
Dream Report delivers countless ways to retrieve data from any number of data sources and analyze that data both simply and smartly. You have the option of applying canned analytics and can create completely custom analysis. But the key is simplicity. No scripting, no programming.
Batch Reports for Food, Chemical and Life Sciences Application
Dream Report knows about Batches. Build batch reports as you want them. Insert graphics and superimpose batch information. Lay them out with Trends and Tables. Dream Report will automatically paginate, dynamically size tables and trends and make your batch reports look beautiful.
Alarm Reporting and Alarm Analytics
ISA 18.2 Alarm Reporting. Dream Report offers a great deal of alarm reporting functionality. With the ability to understand alarm data sources from both relational database and proprietary formats, Dream Report can deliver the alarm reporting and analytics to go along with your batches, processes, and monthly operating reports.