The Designer Studio was design to be used by everyone. Its user interface enables to easily create pleasant report templates. All data extraction is done with the “Dream Report Object Toolbar”. This object library integrates dedicated Object for industrial automation reports.

Finally from the Designer studio, users can define for each individual report their settings about generation and distribution.

DREAM REPORT DATA EXTRACTION

One of the major benefits of the product is about its ability to offer an easy method to extract statistics from all data sources without programming, defining SQL macros or complex scripts. Intuitive dialog boxes enable to configure in few minutes each objects.

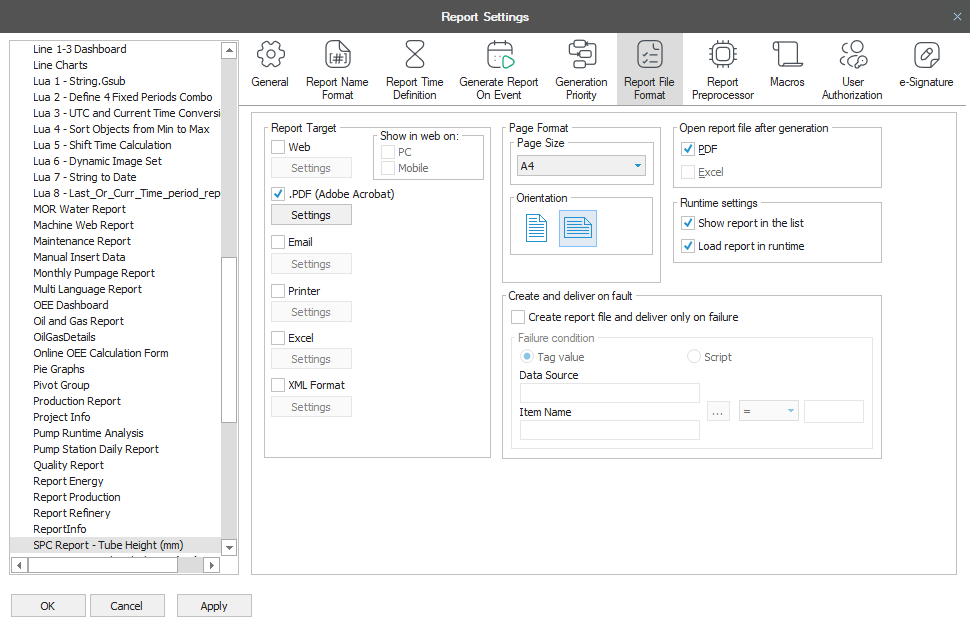
This object enables to extract the Last value, the current value, the Minimum, Maximum, Average, Weighted Average, Sum, Integral, Standard Deviation but also to extract some specific Timestamp, to know the System Availability, the Up time, the down time, the duration of any processes, to do directly Counters and more like also creating directly an SQL query or doing an Expression
This object enables to display in a predefine table data values from the history. Users can select one or multiple Items and define if needed filters, to visualize only specific values.
This object enables to display in a predefine table Alarms and events from the history. Users must create first their alarm filters, and then select the ones they want to visualize in each alarm table.
The SQL table enables to create automatically a custom table with all fields wanted by directly inserting an SQL Query. Indeed, once SQL Query is done Dream report creates automatically for you the table.
The STEP table enables to extract and display statistical values for any period in a pleasant table. User selects the time period and the step (ex: give me the Min, Max and the average value for the temperature for each day during last month)
The Pie Graph enables to compare in a Pie multiple statistical values or alarms filters. Display options can automatically insert the %, the unit, the legend and the values for each segment.
Like the step table, the Bar Graph enables to select a period to visualize by steps statistical values or alarm filters. Different representation modes like Bar, Single Column and Pareto help to high light results.
The Chart object enables to display values, moving average values, Linear and power regression. It’s also possible to display XY charts, mix bars and trends and define different scale options to easily compare results from the same or different time periods.

DREAM REPORT REPORT DESIGN

The Designer enables to create unlimited reports. Each report can be saved as a template to easily create new reports. For each report, users can insert background and images but also define header and footer that will be copy paste in each page. They can also insert automatically the date & time, the page number and specific report’s attributes like its name.

DREAM REPORT REPORT MANAGEMENT

Dream Report is a proactive reporting solution enabling automatic report generation and distribution. Once again, the configuration is done through intuitive menus. A scheduler enables to define in one click if the report will be generated yearly, monthly, weekly or daily. It’s also possible to generate the report on event. Tied to a real time Data, the report will be executed when the condition will be true.

The distribution is also configurable. User can either:

  • Print automatically the report on any printer connected to the network

  • Email it to a predefine recipient list

  • Save it on any file server

  • Publish it over the Web Portal

For this last option a user management module enables to define the access right for each user.