 Business Intelligence (BI) products are all the rage these days. The industrial world brings additional challenges with its unique data sources, access methods and calculations. While the business world revolves around counts and currencies, the industrial world involves many more calculations and data sets that drive the need for specialized “Industrial” Business Intelligence (I-BI).
Most process engineers are spending time with basic tools for data analysis. These tools are often comprised of Excel Add-ins, or other Historian client tools for trending, exporting and analysis. While valuable for troubleshooting and quick and easy to use, these tools do take some time, even if a little time, to generate their results.
Let’s look at a typical use case. A process engineer reviews the data for a recent batch. Historian client tools are accessed, tags are queried, calculations are added or a template is selected and the results are saved away. If another individual needs the results, it’s often a repeat of this process. How long does this take? 10 minutes would seem a reasonable guesstimate.
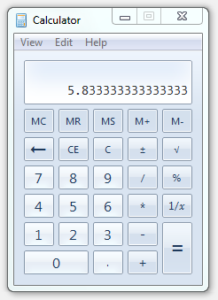
Google tells us that an average process engineer makes around $70,000. And we’ll just use that number and not include company overhead.
With 50 work weeks in a year, and an 8 hour work day, that 10 minutes amounts to $5.83. Let’s say that effort takes place every day. In fact, it’s likely that more than one person uses similar tools for other calculations. Maybe 10 people are checking (or should be checking) their Key Performance Indicators daily. If that’s the case, then your company could be wasting $14,575.00 per year just in 10 minute segments of time spent with basic industrial data analysis tools.
Time is spent in performing an analysis when it could be spent better on other tasks. Human error is always a factor and results may not be consistent. Time is wasted helping others that are not as proficient with the tools. Results are not shared as broadly as they could be or should be, and that limits the benefit of additional reviewers, that could be fostering new ideas for continuous improvement.
Obviously, there is a better way. You should be leveraging an I-BI tool that provides three essential features to empower your team.
- Automatically generate KPIs that are important to your business and save them as archival documents for future reference.
- Deliver the KPIs to those that can act on the results. Deliver KPIs automatically – Email, FTP or print documents for recipients.
- Deliver a self-service browser based portal to recall current and past documents, (without needing to regenerate them) and have access to all underlying data, with tools for additional ad-hoc analysis and troubleshooting, all within the portal.
KPIs that are core to the business should be automated and delivered. Doing so will pay for the necessary solution with-in the first year in time savings alone. An added benefit of automated KPI delivery will be a broader and more routine review, both of which will greatly enhance your organizations focus on continuous improvement. While the benefits of continuous improvement are an even greater justification for delivered I-BI, it’s nice to see that saving just the 10 minutes spent in the use of basic tools can justify the addition of Dream Report to every automation system.
Looking at it another way, by generating a daily report of your KPIs, you’re saving yourself $1,457.00 worth of your time. With the average Dream Report installation having between one and two dozen reports, your installation of Dream Report is very much like “Printing Money.” The addition of each new report is just one additional opportunity to achieve an even shorter payback in months, not years.