See a video about the new release
Even after 10 years, we’re finding exciting new ways to improve Dream Report. We are on the cusp of a new era, where Dream Report transitions from Document Generation to Ad Hoc Analytics. Version 4.7 is a major step in that journey, while also delivering solid enhancements to core functionality.
Our themes for this release are Market Expansion, Ease of Use and Ad Hoc Analysis.
Market Expansion -Not many new markets left. Dream Report is already perfect for utilities and life sciences compliance reporting for EPA and FDA. Dream Report is an awesome performance reporting and KPI Dashboard solution. There was one market that we have not penetrated and that is the world of Statistical Process Control (SPC) Reporting. Move over Northwest Analytics, PQ Systems, Minitab, InfinityQS… There’s a new kid on the block delivering SPC reports and dashboards, with manual data entry and access to data from any existing system.
On a related note, this release of Dream Report also delivers enhanced connectivity to open new markets. That includes the best Citect interfaces of any reporting solution, created in partnership with Schneider Electric. The same goes for our Yokogawa Smart Recorder interfaces, developed through that partnership. Finally, Dream Report offers client support for the latest new Industrial Standard – OPC UA.
At the end of this Post, check out the vertical charts, opening up our ability for advanced heat treat reports and Oil and Gas drilling reports.
Ease of Use – Always a focus for Dream Report. This release delivers improvements at both the strategic level and the tactical level. Strategically speaking, Dream Report now delivers the ability to select and organize your data sources, down to the Tag level. In a world where you are drowning in data, potentially tens of thousands of Tags in your various sources, doesn’t it make sense to be able to group them, organize them and use them effectively? That’s now delivered in the Dream Report Data Model tool. When only 10% or so of your Tags are actually used in reports and dashboards, you can now select just those tags, group them and organize them for your users. Access to your Tags is now based on purpose, role or your ISA S95 equipment model. Best of all, the Dream Report Data Model tool will group and organize Tags from all of your sources, combining them, even your legacy systems that only deliver flat tag browsers.
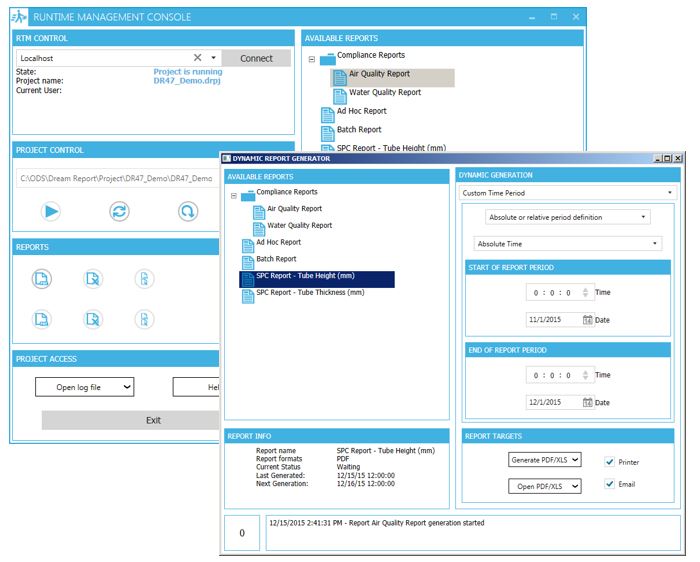
There’s also a new Runtime Management Console (RMC). That’s cleaner, quicker and easier to use. Combine that with a new RMC ActiveX Control and the power of Dream Report is in the hands of your operators, right from their HMI/SCADA display.
Ad-Hoc Analysis – Possibly the most exciting part of Dream Report 4.7. Dream Report is already known as the best Reports and Dashboard solution for the automation world. It is purpose built for this market, so customers don’t need to use Excel, Crystal Reports or SSRS any more. But reports and dashboards are only the first step. Once you see something of interest, then you need analysis tools. It goes in that order – see information, analyse information. So it’s only natural that ad hoc analytics becomes the next phase of Dream Report evolution.
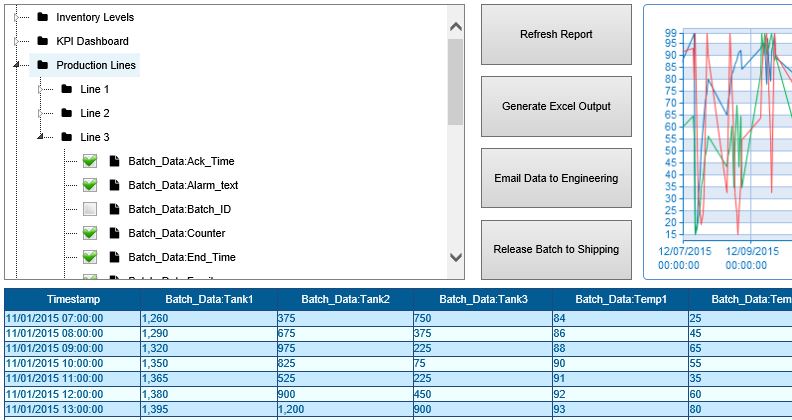
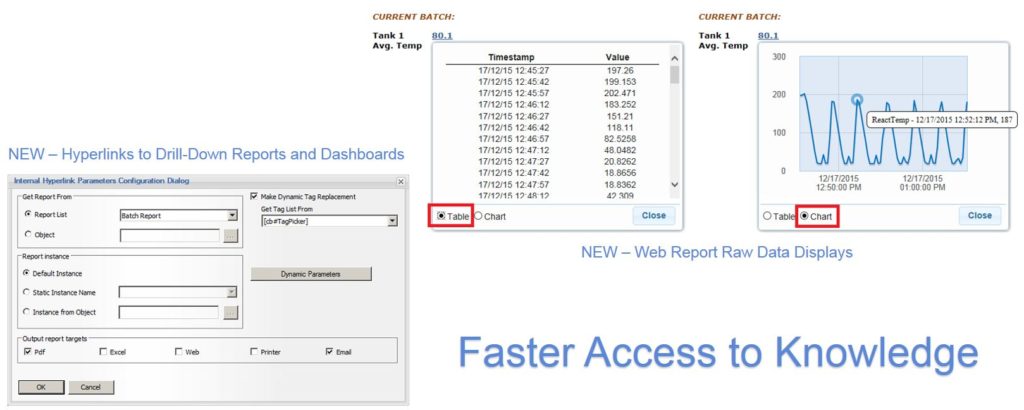
Drill Down Reports – NEW Dream Report hyperlink features enable you to launch additional reports, template reports to deliver your canned analysis, while passing Date/Time/Batch and Tag parameters to that new report. This allows you to give your Dream Report users canned views and analysis for your key KPIs. Click on a monthly total and bring up another report of Automatic Statistics, Trends and Tables. Use that same template report to analyze any of your hyperlinked variables. Include buttons to generate CSV and Excel files.
Hyperlink to Raw Data views. That means you can select a report value and click on it to see a table of the raw data behind that value. You can view results as a table, an interactive chart, and you can export data to the clipboard and use it in other applications.
Stay tuned to future releases – we have lots of exciting new features coming in the area of ad hoc analytics. In terms of what we are planning, Drill-downs and Hyperlinks are just baby steps!
So let’s show you some screen captures from Dream Report 4.7:
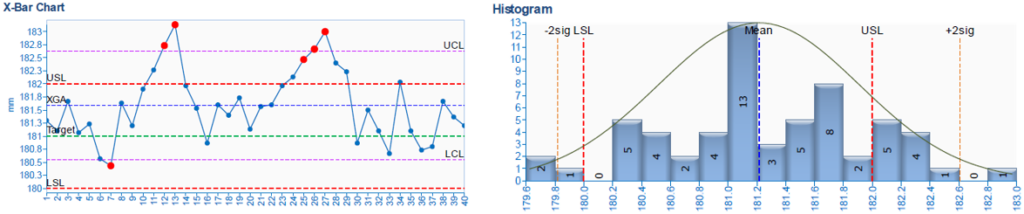
NEW Statistical Process Control Charts and Calculations
The new SPC functionality is an option to the standard Dream Report. Once enabled, there are no limitations. You can generate as many SPC Calculations and Reports as you wish.
The SPC calculations query data from any of the Dream Report data sources. These include your automation control sources, HMI/SCADA, Historian, Relational Database, CSV File, Excel File and Manual Data Entry stores. Grab data from any data source and perform time based or sample based SPC Analysis.
Then display the results in the form of Charts and Tables. Dream Report objects are beautiful and present the results just as you would want to see them. They also highlight results using the standard 8 Nelson rules.
The end result is SPC data combined with all other reporting and dashboard functions that Dream Report is known for. You don’t just have an SPC package. With Dream Report, you have an information delivery solution that can combine all past statistics with new SPC views of your data. This changes the game.
New and Better Connectivity
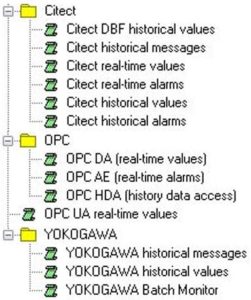 New and enhanced interfaces to data always expand the Dream Report available market. This release delivers the ideal interfaces for both Schneider Electric – Citect solutions and Yokogawa Smart Recorder products. We’ve developed our interfaces with the help of these companies to ensure you get the very best. In addition, Dream Report offers the new Industrial Standard – OPC UA. OPC UA delivers the ability to access real-time information safely and securely from remote systems, even internet based data sources.
Dream Report delivers over 70 interfaces to address all your data source needs. From vendor specific developments to the support of industrial and business standards. You can be sure that Dream Report can interface with the data you want for your reports and dashboards. We are making improvements and additions all the time. Let us know what you need and we’ll work on a solution.
Data Organization and Modeling
Imagine always having the right Tags that you need, when you need them. Not having to hunt for them or consult domain experts for the best Tags to use. You can even have your own Tag Lists, neatly organized the way you want them. You can integrate Tags from all your data sources into one or more lists. You can even organize legacy systems with flat tag lists into ISA S95 Equipment Models. Why? So you can deliver the right data to the right people in ways they can quickly and easily select and analyse that data for continuous improvement and a more agile organization. That will save you money!
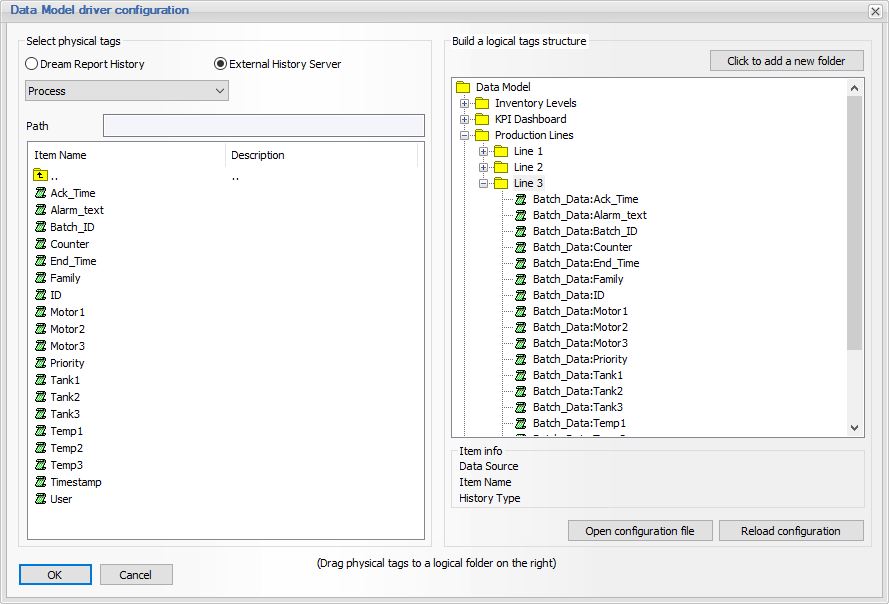
Building your models is easy. You simply create your hierarchy on the right, by adding folders, and then you drag your source tags, from any of your data sources, into those folders. These new Models will appear as new data sources when you’re creating reports or using dashboards in the Dream Report Web Portal.
Ad Hoc Data Analysis
The next major step for Dream Report is in the area of ad hoc data analysis. This is necessary to get to the root cause of KPI changes. You want to click on a KPI and call up a view of the Raw Data making it up. You want to see a Table of data, Chart that data and copy and paste that data into products like Excel for additional analysis. You’ll also want to create drill-down reports and hyperlink to them with a full set of statistics charts and tables that you prefer. The hyperlinks need to pass time-frames of interest and relevant tags. This is just the start of our new functionality. Stay tuned to future releases.
As always – Lots of other features and benefits!
A new Run-time Management Console (RMC) and RMC ActiveX Control delivers user access to the Dream Report Run-time with a new Windows Presentation Foundation (WPC) look and feel. Faster, crisper and easier to use. And, there is a new RMC ActiveX control enabling you to embed Dream Report run-time access and report generation from within your favorite HMI/SCADA or other solution.
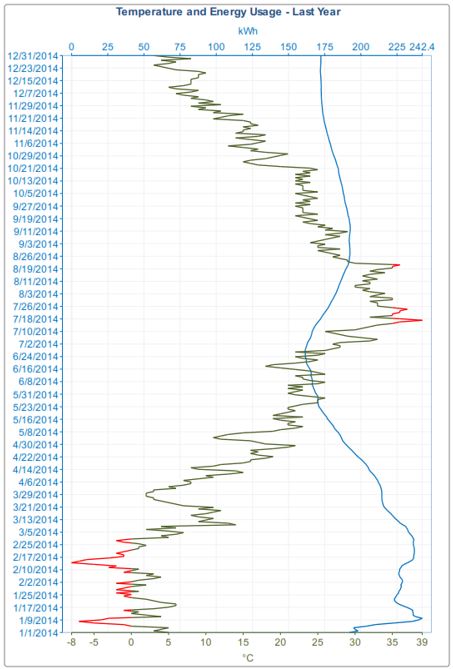
Vertical Charts
Now you can create vertical charts. And, with our Pivot Group feature, you can step your data and cause charts to span many pages.![]()
Why is that important? Some processes have variable lengths (take a long time) and you don’t want to loose data fidelity by putting it all into one chart.
Heat Treat operations are one example. They may run for many hours, and you will want more than one page in your final report. Depth Reports for Oil and Gas Exploration are another excellent example of the need for vertical charts that span multiple pages. Dream Report is now a great solution for these vertical markets. Have a look at “Mud Logging” in Google.