
Unless you’ve installed a new automation system recently, it’s very likely that your legacy solution is still delivering a flat tag space. Most are. And many Historians do as well. Some older systems have significant tag name limitations that have driven your information (Tag Names) to be cryptic rather than being in an easily human readable form. And now, as you’re layering analytic solutions in the hopes of enabling continuous improvement, one of the greatest usability concerns is simply letting users identify the variables they should access for analysis.
Dream Report is now changing all this. It’s new Data Model features allows users to add context to their Tags, regardless of the capabilities of the source. The new Data Model features enables users to organize Tags into folders. Those folders can represent like tags, hierarchical organizations of tags and tags organized for access by specific users. It’s all up to you.
Ideal Tag Organization:
- Tags should be organized logically (Plant Hierarchy)
- Tags should be organized by user and purpose
- Tags organization be easily read by humans
- Tags may need to be shared across many models
- Tools should allow rapid Data Model development
The ISA S95 Standard assists to define an Equipment Hierarchy. It guides you to organize your variables logically, based on the hierarchy of your Plant – Area – Line – Unit – Variable. An equipment hierarchy enables users to quickly and easily access their variables of interest and then select them for further processing. There are also times when Tags need to be organized by purpose, grouped for users or grouped into folders for easy access.
Dream Report version 4.7 introduces new and flexible grouping to facilitate ISA 95 Data Models and much more. Dream Report offers over 70 interfaces to address all your data sources. These data sources expose their information in the form of Tags – names for the variables. These Tags, from all your various sources, may now be organized into one or more Tag Models. You can organize them, by Plant, Area, Line, Unit etc. as you see fit, to make then easily accessible for your users. You can hide Tags that are not valuable to users. You can organize Tags by individual users or by purpose.
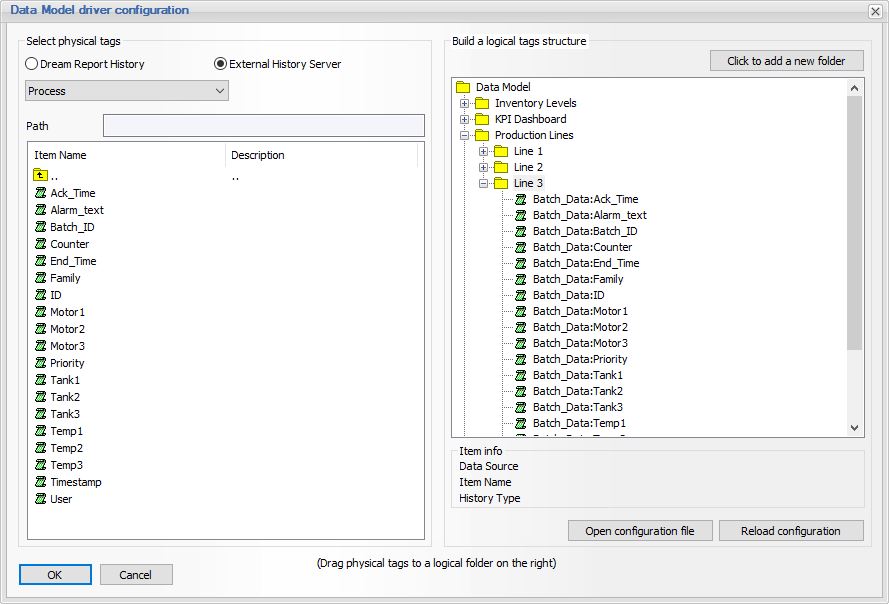
The process is a simple one. A new Data Models Icon launches the Data Model Driver Configuration. You are presented with the new ability to create one or more Hierarchies, giving each a name, and then drag and drop variables from your existing data sources, into each Hierarchy. Each Hierarchy becomes a new data source. In the past, you would browse your data sources directly. Now you can browse those data sources through the benefits of a Data Model, accessing only the variables you need through these new groupings and a plant and equipment hierarchy that makes them easy to locate.
The Benefits? Your plant managers will be able to drill down to KPI variables quickly and easily. Those responsible for particular areas will be able to access their Tags with greater ease and with fewer errors. Report development becomes even faster. Ad-hoc analysis becomes even easier.
During report configuration, users are able to browse Tags that have been grouped and organized, combined from various data sources, associated with a Data Model. As applications grow in size, major efficiencies can be gained through the automated generation of data models. Dream Report supports this by saving and loading Data Model definitions from XML files.
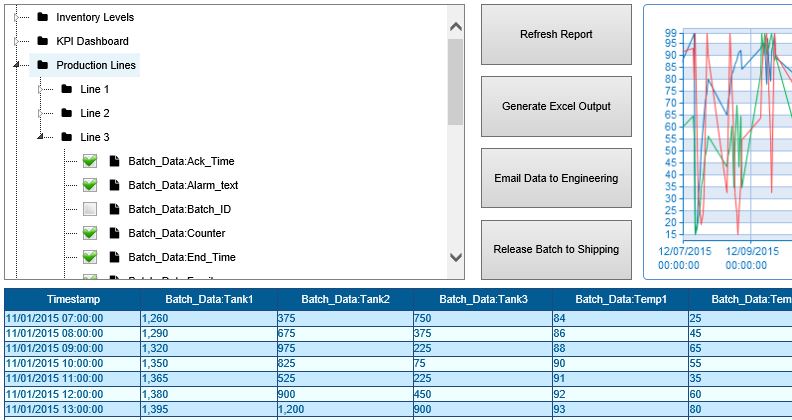
Data Model configurations may easily be accessed during runtime, in the Dream Report Web Portal. Users will now have the ability to confidently and quickly access the key variables they are responsible for and perform report generation and ad-hoc analysis.
Data Models are just one more reason Dream Report is the ideal solution for industrial strength Reports and Dashboards.
