
An Industrial Analytics Solution Automatically Generates Results in One Step for Reports and Dashboards
This benefit would seem obvious, but many reporting solutions are more adept at pulling data from a data source and placing results into an Excel Workbook for manipulation, than giving you the one data result you are interested in. Reporting solutions that leverage Excel will typically query data automatically or manually, populate a Worksheet in a Workbook, where you surround that data with the calculations and scripting required to formulate your result, and then have you copy that result to another Worksheet that is formatting your final document. That’s a lot of work, and most users are not adept enough at Microsoft Excel to perform the scripting and matrix manipulation required.
A better solution is to focus on the task at hand, querying data automatically, and then processing that data to achieve the result. For the end user, this should be the holy grail. For the product developer, this requires a deep knowledge of the automation industry, common calculations to be performed, and common techniques for selecting data-sets.
Dream Report has been designed with all this in mind. Here are the functions of a “Purpose Built” Industrial Solution, for generating the right result out of an industrial dataset.
-
Selecting Industrial and Business Data
- Time – Every object in a report or dashboard can include a dataset defined by times – absolute, relative or fixed references.
- Batch – Every object can reference datasets by batch IDs that define start and end times
- Calculated Dates/Times – Every object can reference times generated through other statistics.
-
Filtering Industrial Data
- Creating subsets out of a data-set. For example, selecting the temperatures for the previous week, while a process is running.
- Advanced Filter Condition – Like a SQL WHERE statement, the Advanced Filter enables the selection of data from a set, WHERE another condition exists, PROCESS=RUNNING, Motor=1, etc.
-
Conditioning Industrial Data
- These features enable the user to scale data or combine data for follow-on use.
- Correction Factors – enables the use of an equation to scale data, converting from C to F or MGD to MGH. Etc.
- ADF (Aggregated Data Filtering) – enables the user to aggregate data into groups based on time or samples. Convert Seconds Samples of a variable to Hourly Averages for use in a subsequent calculation.
- Multi-Tag Aggregation – Ever wanted to trend the sum of two flows? Or generate an overall integrated total of multiple streams? That is what Multi-Tag Aggregation is all about. You can create a new VIRTUAL Tag that can be referenced as any other External Tag and perform calculations on them. Virtual Tags are not counted when sizing an application.
-
Industrial Calculations
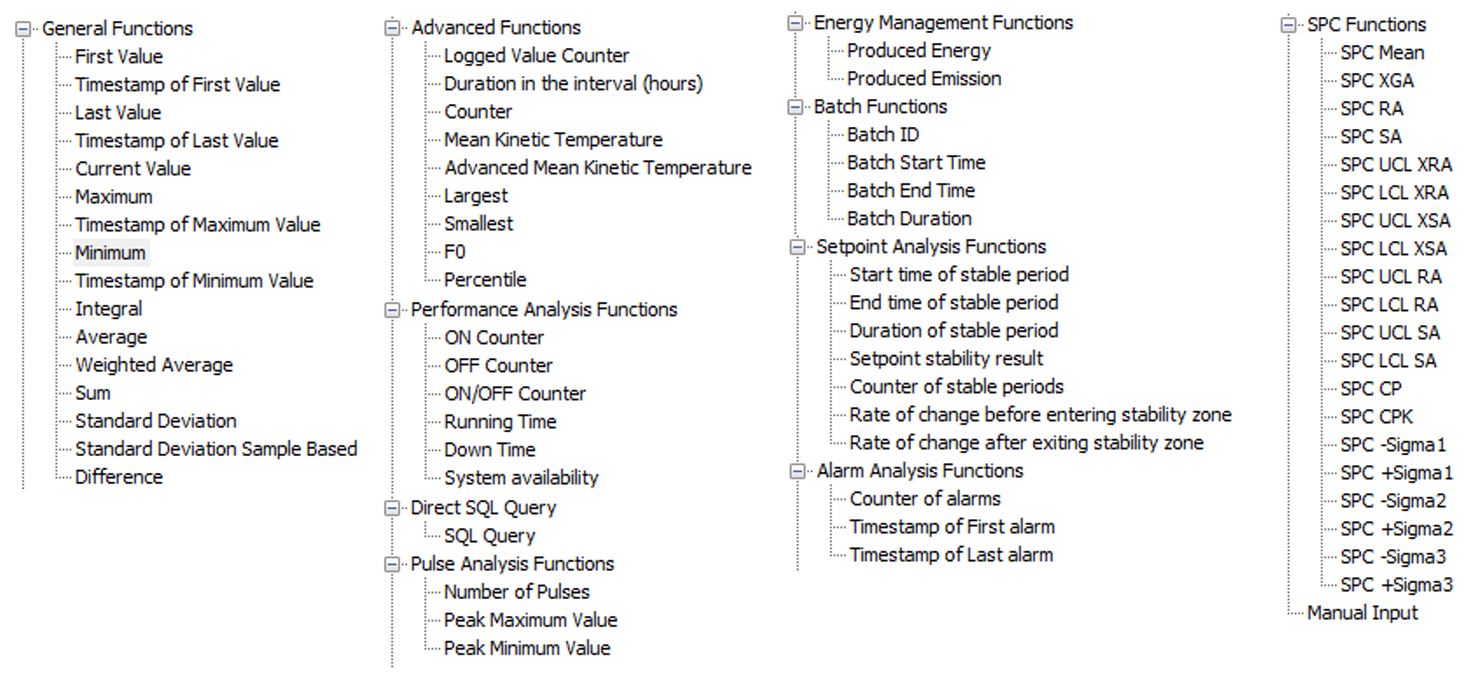
- Vertical Market Calculations – Statistics for every industry. Lethality calculations for Pharmaceutical. Mean Kinetic Temperatures for Dairy and Food Storage. Integral calculations for Water and Waste Water. Count Operations. Time Operations. Totalize Runtimes. 73 purpose-built calculations make the most demanding vertical market statistics trivially easy.
- Simple Tag Combinations – Compound functions will let you select the Max, Min, Average, Sum of a group of Tags.
- Free-Form Math Equations – Have a math expression you would like to process? Not a problem. Type any equation with any Tag References you would like.
- If-Then-Else, File Operations and String Manipulations – All part of a simple to use (but rarely required) scripting language for the power user. With this functionality, Dream Report can generate ANY result you can possibly imagine.
The functions above are critical to delivering the tools needed for the right statistics in the automation space. These features enable Dream Report to generate the results needed for compliance and performance reports and dashboards, all around the world and in every industry.
Summary – A Software Solution Delivering Industrial Analytics for Automation Systems
The world of industrial automation presents data challenges that only a purpose-built industrial product can address, both simply and easily. Industrial solutions that embrace or extend business products for industrial applications present many challenges to the user. The complexities (time and effort) to overcome those challenges will make the long-term cost of ownership of business product integrated solutions greatly exceed that of a purpose-built solution.
That is the primary reason to invest in Dream Report, as your reporting and dashboard solution.
Please Download our Free Trial and Generate Reports and Dashboards
