
Choosing the Right Technology for Your Energy Management Solution
The Key to Energy Management is Leveraging Industrial Reports and Dashboards for Continuous Improvement
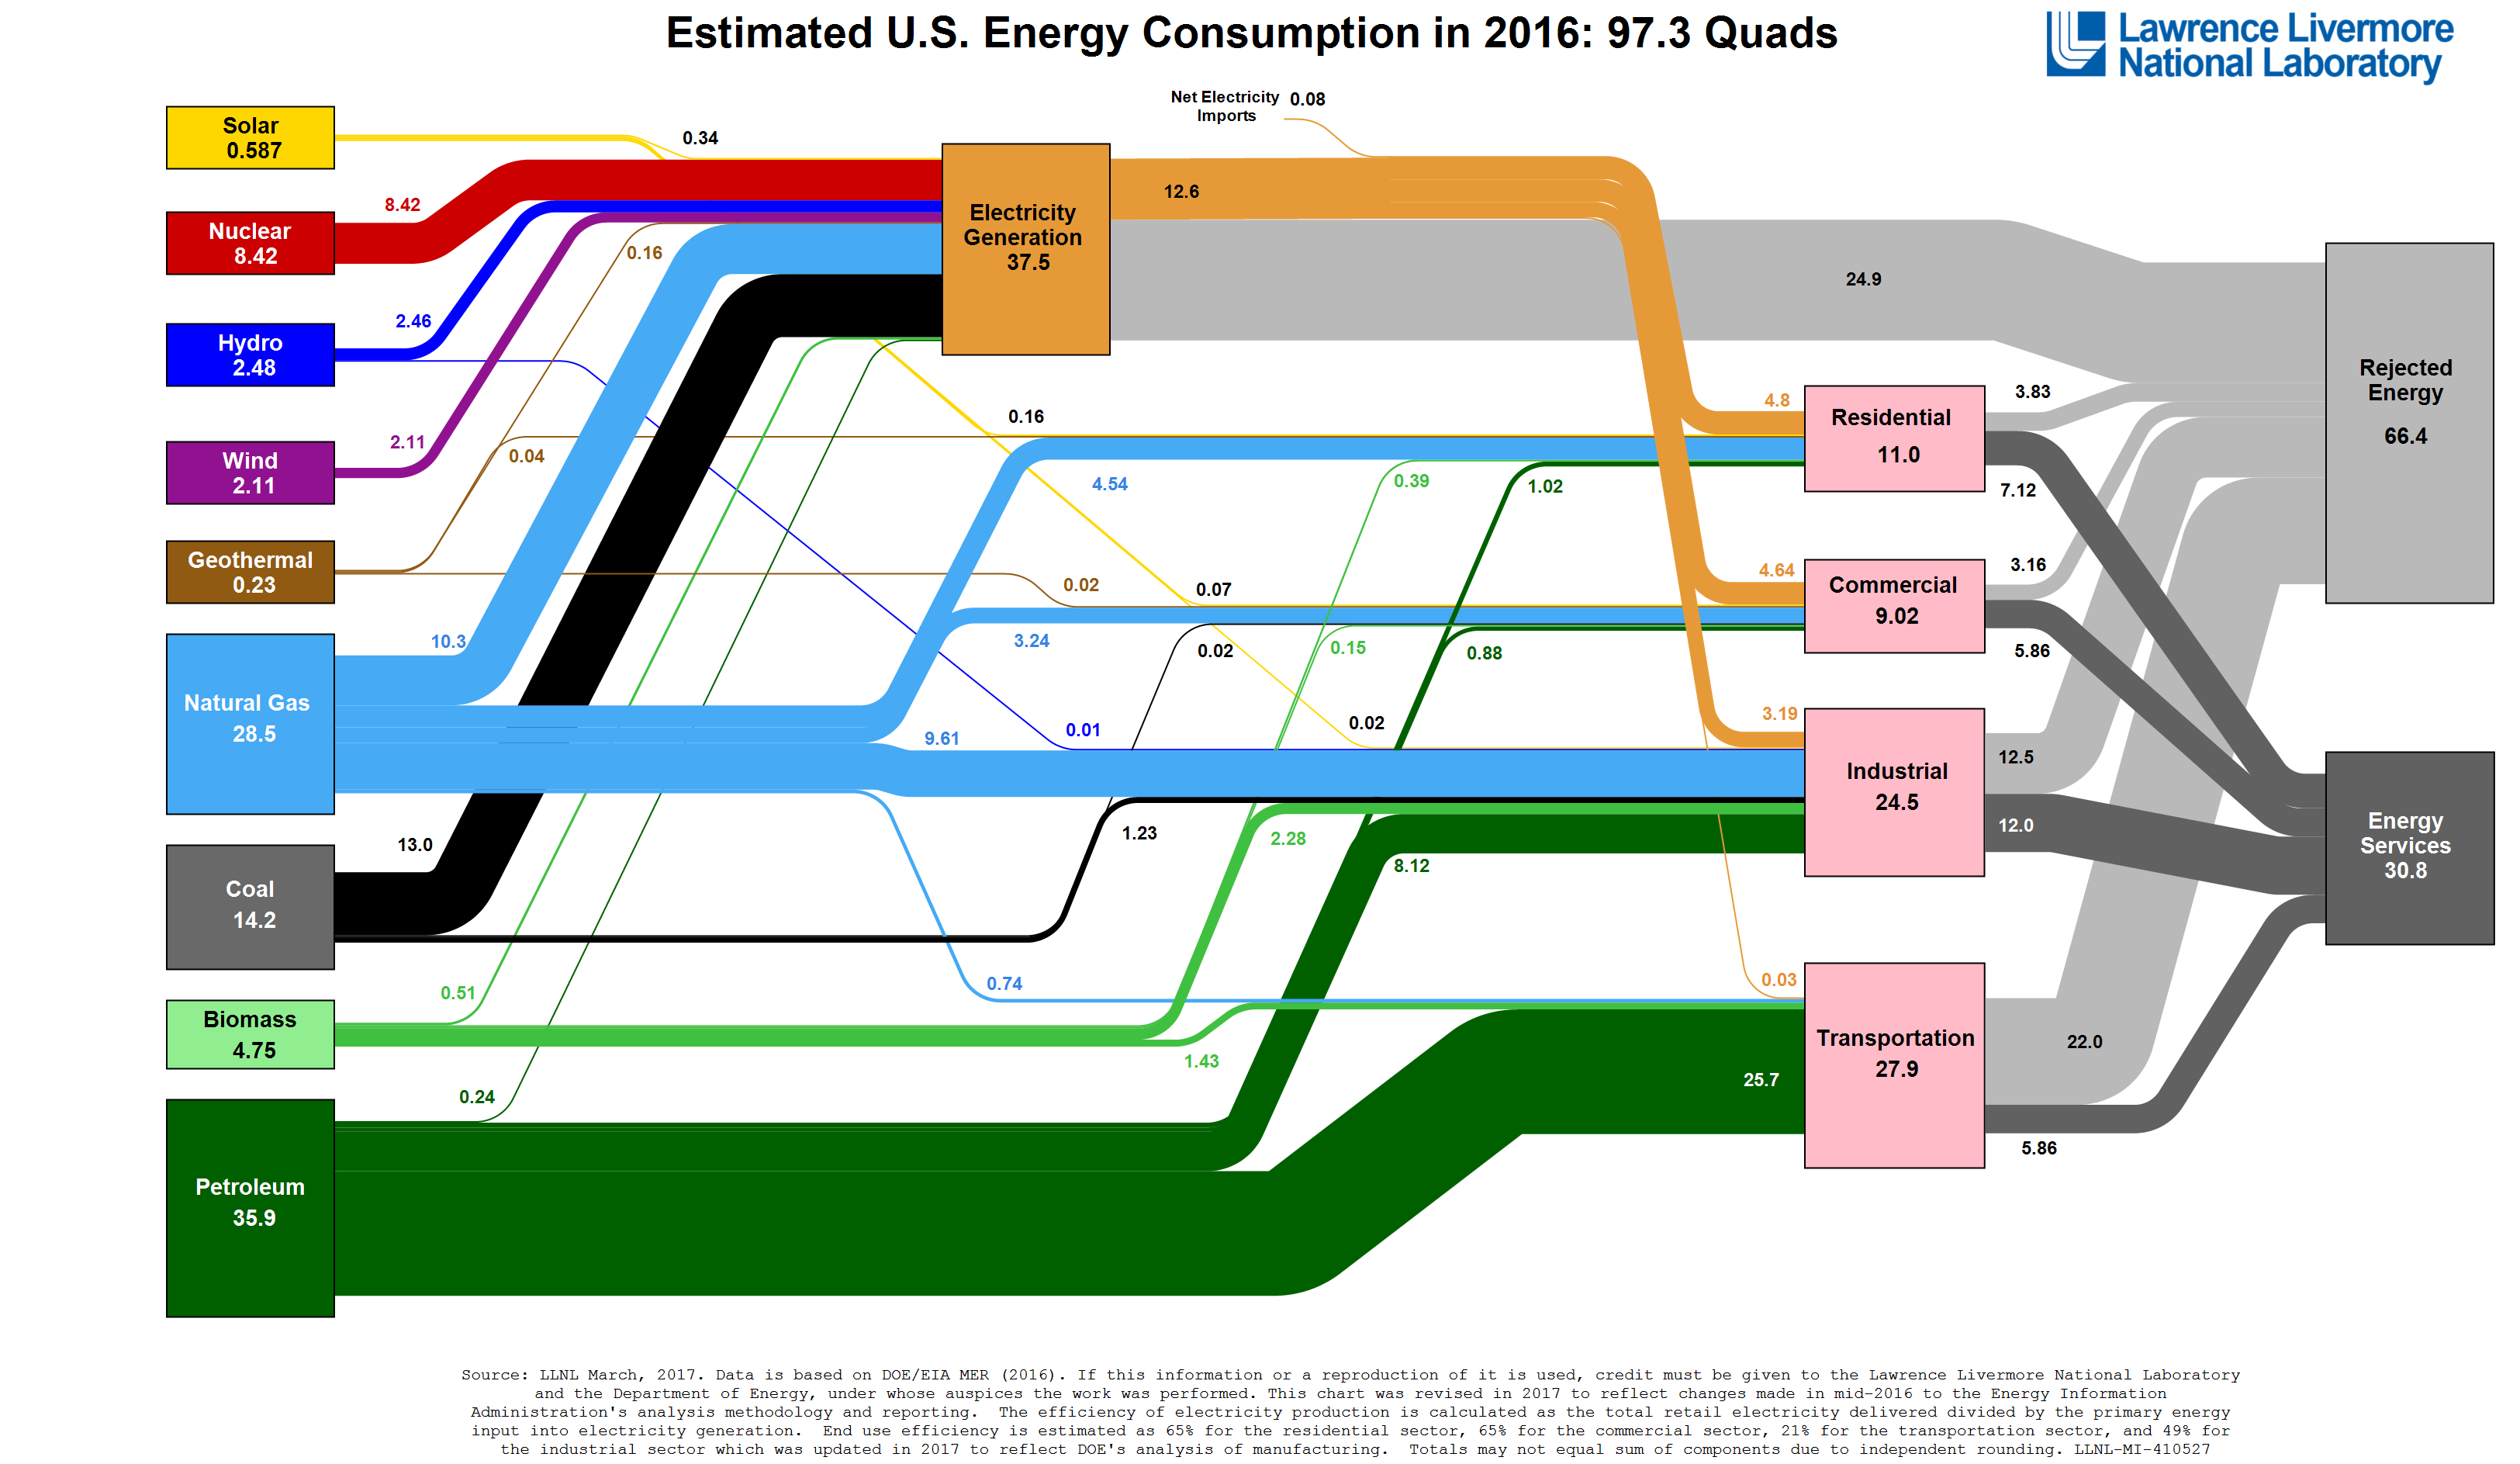
Energy Management is a very broad topic, spanning most markets. However, in all cases, there are fundamentals that need to be considered. From the chart above, you can see that inefficiencies in today’s processes, overall, waste more energy then is used. Regardless of the energy source, or the use, a penny saved is a penny earned.
Simply put, the goal of energy management is to improve reliability and manage cost. The systems involved with energy management are plentiful and include both industrial automation and building automation products. In many cases, users even “Roll Their Own” through the integration of business technologies. The devices being monitored are equally diverse, including both industrial and commercial products. But in all cases, there is commonality to the types of data analytic operations to be performed.
Required Features of an Energy Management Analytics Software Solution
Energy Management analytics will include the monitoring of status (on or off), setpoints and levels (analog variables), and the generation of energy management statistics, and most importantly, the delivery of those energy management statistics with context. Information only becomes actionable in comparison to past or desired results. The ability to access all data for analysis involves either the centralization of all data into a common database, or the ability to reach into various disparate data stores. Centralizing data brings with it the downside of “multiple versions of the truth,” where data centralization (typically replication), may introduce gaps and errors for any number of reasons.
Reaching into your various stores will require connectivity to your data in proprietary systems, through many APIs, both custom and standards based, a challenge for many standard business intelligence (BI) solutions. Moreover, the analytics to be performed are somewhat unique to the energy management market and are also challenging to perform with typical BI solutions. Energy Meters and PLC (Programmable Logic Controller) Registers used for energy totalizations will typically roll over at 999,999 or 65,535 (or some other value) therefore, the ideal analytic solutions need to account for such conditions automatically and easily without significant programming or scripting. This is the greatest challenge when applying most BI solutions to energy management applications.
Additionally, many Energy Management related products archive data with both compression and data quality statistics. An analytics solution needs to be able to account for “Bad Quality” and deliver the special data handling that accompanies compressed data (integration of energy flows as opposed to the totalization of regularly stored results. These simple examples highlight why energy management is better handled with “Purpose Built” solutions, as opposed to trying to use your typical IT department BI tools.
Statistics and Analytics that are Common to Energy Management Systems
On the discrete side, statistics for Cycle Counts and Run-times are most common. On the analog side, offsets from setpoints, the totalization of costs, comparisons to degree day figures are the statistics that are most common. In all these cases, the generation of a Key Performance Indicator (KPI) is valuable, but only when compared to that same KPI in a past context or against a desired context. This requires the ability to display statistics in a dashboard or report with varied data sources and varied time definitions. Varied data sources will be needed for the retrieval of archived past results and varied time will be needed to create a comparison context for current state versus year to date, last year, last shift, last batch, etc. It is only through this context that the user will have the information needed to improve operations.
Regulatory Requirements drive many of the statistics to be performed. For example, in Europe, the EPBD (European Performance of Buildings Directive) outlines the calculation of a building energy coefficient. This requires monitoring outside variables, energy utilization for space and water heating, lighting, air conditioning, ventilation, occupancy and more to create a statistic that can be tracked over time. Calculating the carbon footprint will require the totalization of fuel use and reasonable conversion statistics based on stochiometric conversion to CO2 production. In the USA, building energy management – utility statistics are benchmarked with other like sized and similarly purposed properties through the Energy Star Portfolio Manager program. A purpose-built solution for energy management will have these and other typical calculations built in and will greatly reduce or even eliminate the need for custom statistics development as required in BI solutions.
Energy Management Data is Typically Found in Many Data Sources
Once you are working with an information management solution, you’ll quickly realize that there’s more to a complete story than the information you get out of one system. Why were these building energy statistics so different this week? An OPC (the industrial industry information standard) query of production data will show a system shutdown. Why was this energy meter reading so off? A SQL query of the asset management database will show a meter replacement. Why was this conference room so costly? A BACnet query of thermostat settings show it in manual override. Clearly, the ability to access all of a site’s information systems will deliver a holistic approach resulting in exponential benefits. While there are common statistics for energy management, the ability to enhance the context of a result with data or statistics from other systems will increase the ability to take action.
Energy Management Reports and Dashboards Empower the Users
The drive for continuous improvement almost always culminates in information in a Dashboard. A Dashboard is typically a dynamic display of your KPIs. A dashboard can be delivered as part of a proprietary system (a component of your building automation solution, or energy metering solution), or it can leverage the most prevalent information delivery solution, a Web Browser. More and more, we are seeing user interfaces that are based on Web Browser technology, specifically those based on the latest HTML5. These include the 4 most popular browsers (Internet Explorer, Edge, Google Chrome, Apple Safari, and Mozilla FireFox, both in full computer and mobile device formats).
There are three areas of functionality that should be a part of every information solution. As previously mentioned, a Dashboard, designed to deliver as much context as possible, is the most relevant interface. A Dashboard empowers the person viewing it, but if you don’t view it, that opportunity for continuous improvement is lost. Ideas for continuous improvement can come from employees you might least expect.
Dashboards are rarely shared with all those who could benefit from them. Or perhaps access to the IT systems containing those dashboards is limited for security reasons. This brings up the need to deliver results in more than one form. Dashboard snapshots, in the form of a report, can be an excellent solution for delivering results. Dashboard report files can be delivered to Windows directories or remote FTP locations. They can be distributed via email. They can contain links to previous Dashboard Reports for enhanced context. Reports can contain links that will take you to the current Browser based Portal. In the end, generating reports and sharing them broadly will improve your opportunity for continuous improvement. Reports can take several forms and are most often delivered as a PDF archival record, but they can also be delivered as Excel files, CSV or XML files.
When something is wrong, looking at a Dashboard or a Report just isn’t enough. At this point, an energy management solution needs to deliver access to any available raw data. You’ll need to trend, pan, zoom and export variables from any of your sources, to get to the root cause of any issue. While the impulse to involve domain experts at this point is natural, the concept of information access, performed as easily as possible through a self-service portal can empower anyone to get to the root cause of a problem. If there are repetitive queries that are of benefit, then the generation of new dashboards and reports needs to be easy to perform, removing the need for ad hoc analysis and troubleshooting.
Energy Management solutions need to become a component to the overall operation of the enterprise, regardless of the market you are in, if you want to maximize your potential benefit. Taking the information or dashboard from your energy management system and integrating that with your other HMI/SCADA or information solutions should be easy and flexible. Purpose Built solutions will give you multiple ways to host information, either data results or complete dashboards, in your existing systems.
Typical Options for Energy Management Software Solutions
The solutions for energy management will typically fall into three categories.
- Vendor specific solutions that are designed for that specific purpose and installed by the vendor or a System Integrator
- Custom integrated solutions that are installed and managed by a System Integration firm or IT domain experts
- A broader solution that both fits the purpose and is designed for a broader implementation audience – typically those in-house process and energy management domain experts.
The benefits of each will vary greatly.
Vendor Specific Energy Management Solutions
They typically deliver the solution easiest to deploy as they are specifically designed for that one purpose and include connectivity to the products being supplied. While their value lies in their quick startup and targeted functionality, their flexibility is limited as is their ability to embrace an enterprise wide view of energy management.
Custom Integrated Energy Management Solutions
These are more tools oriented and are often implemented by those with a tools domain experience. This category also includes those that have tools experience and prefer a more manual or interactive approach to energy management, leveraging tools for data access and manual analysis over a completely automated solution. It is interesting to note that this category makes up a broad part of the market since the early 1990s, when most automation systems incorporated the data access standards common to the business world, namely ODBC (Open Database Connectivity) and OLE-DB (a newer standard based on Microsoft OLE Object Linking and Embedding). While these standards do enable easy data access, they generally don’t aid with the unique requirements of analytics, the ability to work with Data Quality information or easily manage statistics based on time series data compression – common in industrial systems. These “Custom Integrated” solutions deliver a low initial technology cost, often based on Microsoft Excel, SAP Crystal Reports and Microsoft SQL Server Reporting Services (SSRS) technologies, but require a much greater initial implementation cost and higher long-term cost of ownership. As a custom integrated solution, they are typically more fragile in terms of overall robustness.
Vendor Independent, Purpose Built Energy Management Solutions
These have both broad industrial data source connectivity and specialized energy management analytics as standard features. Broad connectivity is often delivered using industrial communications standards including MODBUS and OPC. Even in this area, solutions will fall into two categories, those specifically for Energy Management and those that are broader in nature and also address energy management functionality. While pure energy management solutions are certainly fit for their purpose, as highlighted earlier, the ability to integrate with other data systems will bring a more well-rounded view to operations and areas of improvement.
One product checks all the boxes
One product is addressing all energy management and industrial business intelligence applications and has effectively become the go-to for industry. That product is Dream Report, by Ocean Data Systems.
Dream Report areas of excellence and differentiation:
- Over 80 interfaces – to all industry leading data sources, both industrial and business. These interfaces include Real-time Data, Historized Data, and Alarm Data.
- Specialized statistics – In addition to Energy Management specific functions for Fuel Energy Contents, CO2 production, Runtimes, Cycle Counts, Percent Utilization, Meter Rollover Handling, Energy Flow Integrations, Dream Report delivers the ability to handle any user defined mathematical formula. When the requirements move into highly specialized areas, there is even an If-Then-Else, String and Statistics Scripting capability called LUA.
- Flexible Time Management – As stated earlier, Dashboard or Report Results are only actionable if they are presented in context. In the world of Energy Management, that is usually a month to month comparison, year over year comparison or event to event comparison. These comparisons require time management on both a whole document as well as per statistic basis. In this way, a daily report can show the same statistic for yesterday’s data or that from the same day last month.
- Flexible Result Formatting – adds even more context to results. Values may be Bold or Color Coded. They may have static formatting rules or depend on other variables. The formatting of single value results, table cells, X/Y and trend charts and other objects will enable the quick action of a reviewer.
- Documents need to take many forms – such as PDF for tamper proof archival uses, HTML5 Dashboards for PC Browser and Mobile based interactive access, Excel Files – often required for regulatory compliance or for reviewing and formatting data for uploading to other systems (Energy Star Portfolio Management for example). Excel is also a valuable environment for additional data analysis.
- Document Delivery and Management – is needed to drive continuous improvement. Dashboards are only helpful to those that look at them. In our fast paces and over burdened world, few have the time or desire to add a daily review of dashboards to their schedule. Information needs to be emailed, files need to be delivered to data stores such as Microsoft SharePoint, Files should be organized into directories, and old files should be automatically deleted.
- Integrated Results – need to come from all data stores, maintaining one version of the truth and delivered in a single report or dashboard. This integrated view of your entire operation will deliver the best possible view of your enterprise and will enable the greatest opportunities for continuous improvement and root cause analysis.
