 The first definition of a batch needs to begin with a process that has a variable start and end time. The two may be linked, for example a variable start and a known process that ends a defined period later, or it may be a process that ends on any combination of conditions.
Of course, the definition of a batch can also become much more complex, with variable steps, equipment and phases. That will be a discussion for another day. Dream Report has support for that too – no wor
ries.
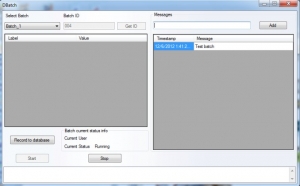
Let’s explore that first definition a bit more. Doing so will highlight many processes that can be addressed by a Dream Report option called DBatch.
When we say batch, we are typically discussing a chemical process. But if we are talking about processes with variable starts and stops, we are swinging the door wide open. Let’s highlight some examples:
- Water Treatment – Filter Bed Regeneration
- Power Generation – Turbine Startup and Shutdown Processes
- Heat Treat – Heat-up, Soak and Cool-down
- Equipment – Backup Generator Monitoring, Emergency Lighting, Industrial Compressors, Machining Operations, HVAC Cycles, Tank Fill Operations, Furnace Operations, Pump Cycles, Drilling Controls, etc.
By identifying automatic starts and ends to repetitive processes, you can now leverage the benefits of Dream Report “Batch” features, over an aggregate of these operations. These include reporting over the last X Batches. Report operations that passed or failed. Report process durations. Report process max, mins, average or totalize functions. Compare processes to an ideal (typically called a Golden Batch).
For example, in the world of power generation, a steam turbine is one of the most expensive assets. Its operation is complex. A startup requires adherence to a predefined temperature ramp and soak profile, to ensure that mechanical parts expand in a controlled and safe manner. Over-stressing a turbine during start-up can damage the unit and void its warranty. Careful monitoring of the startup is critical. Dream Report to the rescue.
In another case, emergency equipment that runs infrequently, should be monitored and the equipment data should be profiled over time. With Dream Report, you can perform analytics from operation to operation, even graphing the start-up and operation of one to the next. What can you gain from viewing the current start-up, compared to the last, and one before that, and to the first few at time of installation? Plenty. Are temperatures similar? What’s the best way to calculate alarm limits for the system? Dream Report can calculate the maximum temperatures reached over the past x cycles, add 5% and automatically set or recommend the alarm limits for you.
So, what else can Dream Report do for you?
First, it gives you the option to specify “Batches” or variable process manually, or can calculate them automatically. Dream Report can monitor a start condition and a stop condition. Based on rules you define, Dream Report will automatically create an event name and capture the start and stop times. You can specify other required data as well, such as event descriptions, operators, etc.
Dream Report objects are smart. If you place a Chart on a page, you would typically specify a time. But you can also specify a “Batch” or event name. In that case, Dream Report will use the batch table as an event start and stop lookup, and will automatically set the Chart period. Dropping a Step Table is just as powerful. You can specify to view the past X events (Batches) and calculate Duration, Start and End times, Event ID, and perform calculations over the event interval such as totals, mins, max, averages, counts, and any of the other statistics that Dream Report offers.