If you’re like most companies, then you’re using a report generator for compliance reporting – generating the reports you need for regulatory agencies, or documentation required to validate a product quality. The reason most don’t take it further, and start reporting on nice to have items, generally stems from the difficulty in using most reporting tools. Most require IT or developer level personnel and most reporting products are only developed to report against one data set, the primary task they were designed for. There is an alternative, and it opens many new doors for creating status and KPI (Key Performance Indicator) reports for all the nice to have items in your facility, not just the must haves.
One of the keys to enhanced security and reliability is familiarity. Viewing information on a regular basis makes you familiar with the usual, giving you the ability to discern the unusual. Sure, you can set alarms to highlight the unusual, but you’ll benefit from the knowledge you gain through reporting, to gage the levels of deviation and assist you with the proper course of action. This is especially true for infrastructure management, keeping track of the IT equipment that makes up your infrastructure. The tools to manage your infrastructure are well known, but are often only used when there is a problem. One often overlooked opportunity to drive familiarity, comes through automated documentation of your IT system operations. That is where the right automated report generator, with the capability of integrating many sources of information comes in.
SNMP makes infrastructure reporting possible
But before we discuss the report generation, let’s focus on one technology that makes infrastructure monitoring possible – SNMP (Simple Network Management Protocol). SNMP is a part of any quality IT product, from Wireless Access Points to Routers, Desktop Computers, Printers, UPS Systems and more. SNMP is a communications capability between a client application like a reporting solution, and an SNMP Agent – the SNMP communications functionality that resides on the device. The SNMP Agent typically offers a MIB (Management Information Base file) that describes the information that can be accessed (Read or Write) from the device. The MIB lists items that are available in a device and references them through the use of unique identifiers – OIDs (Object Identifiers). For example, an OID to access the number of processes that are running on a Microsoft Windows based computer is – 1.3.6.1.2.1.25.1.6.0. If you address a computer by its IP, with SNMP enabled (it’s a standard operating system feature), and address that OID, then the response data value will simply be a number representing the software processes running on the machine. While the number is not particularly important, noticing a change over time is potentially important. When talking with other devices, such as a wireless access point, you can have indications for the number of connected devices, or the bandwidth being used. If you are talking to your printer, you’ll have indications on paper levels, ink or toner availability and its current status. If talking with a UPS, the data can represent voltages, UPS health or remaining Backup Time. There are thousands of items that can be monitored through SNMP. Clearly, SNMP is a valuable window into the operations of your IT Infrastructure, and it should not just be used for troubleshooting, as is often the case.
Reactive behavior will drive habits
Creating familiarity with your processes, from production to infrastructure, is a benefit to everyone. This can easily be done by defining reports for your most important assets, processes and business mandates. Sharing these reports widely, not just to those that are responsible for them will breed familiarity and promote discussion that would not otherwise occur within your enterprise. These discussions can only help drive your initiatives, the understanding and awareness, in a positive direction.
Most would have suggested corporate dashboards as a mechanism to display and share information. Unfortunately, dashboards, by themselves, require users to be proactive – accessing the dashboards during their day to day activities to see what is happening. These days, few have the idle time to go out perusing dashboards looking for knowledge. This is a reactive world. Delivering a report to an inbox, regularly, and when there is an anomaly, is the ideal solution to both foster familiarity with information and trigger an action when action is needed. Then, include a link in the report to take users to a dashboard, that can be managed by the report generator, or be an additional technology for further follow-up and analysis.
About report generators
In the world of Industry, there are few good options for automated reporting. Vendor solutions are available, but they typically focus on the datasets available only for the one product or technology they are designed to operate with. Business oriented reporting options, such as Microsoft SSRS (SQL Server Reporting Services), or SAP Crystal Reports, are powerful tools, but they are not aware of industrial data sources, and they require a very high degree of competence in their configuration. What is needed for industry, is a reporting solution that is developed specifically for the world of industrial automation, and is oriented to making process engineers, not just IT professionals, productive.
Anatomy of a reporting solution
Automated reporting, designed for Industry, consists of 4 stages:
1) Acquiring Data – connecting to your sources of data through a variety of interfaces. These interfaces will connect to real-time data – polling equipment or receiving alerts, Logs of event data, and repositories of historical data. The data sources should be abstracted to the user only needs to specify a data item of interest for subsequent analysis. For infrastructure applications, these sources include SNMP Polls and Traps, Logs from various systems, and connections to specialized equipment through proprietary protocols such as MODBUS, or industry standards. Equipment typically includes servers, routers, storage systems, UPS systems, but can also include items such as physical security, and building management or HVAC systems.
2) Analyzing Data – creating the statistics that will inform you as you see fit. These are any number of KPIs (Key Performance Indicators), but will often include network statistics, memory allocation, process status, energy use, user access information, uptime metrics, system availability stats and much more.
3) Presentation of the Data – This is the visual stage, taking the analysis and formatting it into tables, trends, Pie Charts, Histograms, and a myriad of other data representation objects that convey the necessary information.
4) Delivery of the Data – Transferring the reports to those that can benefit from them. Reports should be generated on a combination of event and time. Time based reports are best delivered at a consistent time, to develop a routine for the users. Event reporting is valuable to highlight anomalies that require attention or action. The delivery of reports can take many forms, from PDF files delivered by email or placed in a file repository, to HTML versions displayed in a Web Portal (a Dashboard), with language localization and security.
Delivering reports will drive continuous improvement.
As previously mentioned, automated reporting of KPIs and operational data will drive a familiarity with your infrastructure. That familiarity will reinforce the understanding of the usual, which will enable users to identify trends and unusual behavior. The ability to see change over time, will let you anticipate future work, and plan for outages and upgrades.
The use of a report generator will likely be justified by your compliance needs. The addition of drivers for infrastructure monitoring or other “Nice to have” data sources, will deliver additional and very cost effective information to help drive continuous improvements in scalability, reliability and security.
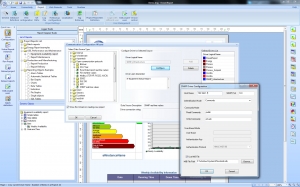
Dream Report Designer Studio SNMP configuration