Reports and Dashboards Delivering Overall Equipment Effectiveness (OEE) Help Drive Continuous Improvement
One of the many capabilities of Dream Report is its ability to take raw process and equipment data, and present it in the specific context of a problem that needs to be solved. In the case of Overall Equipment Effectiveness (OEE) reporting, Dream Report can utilize raw machine state data (Running/Not Running, or simply, 0’s and 1’s) to calculate m
achine availability, and hence OEE, over any defined/planned production time period.
OEE % = Availability * Performance * Quality
When configuring an Overall Equipment Effectiveness (OEE) report in Dream Report, the following approach is recommended:
- Connect to a data source(s) that contain machine data – e.g., a process Historian, PLC or HMI
- If the machine data is not already logged in a historian or other data logger, use Dream Report’s data logging feature to record the data
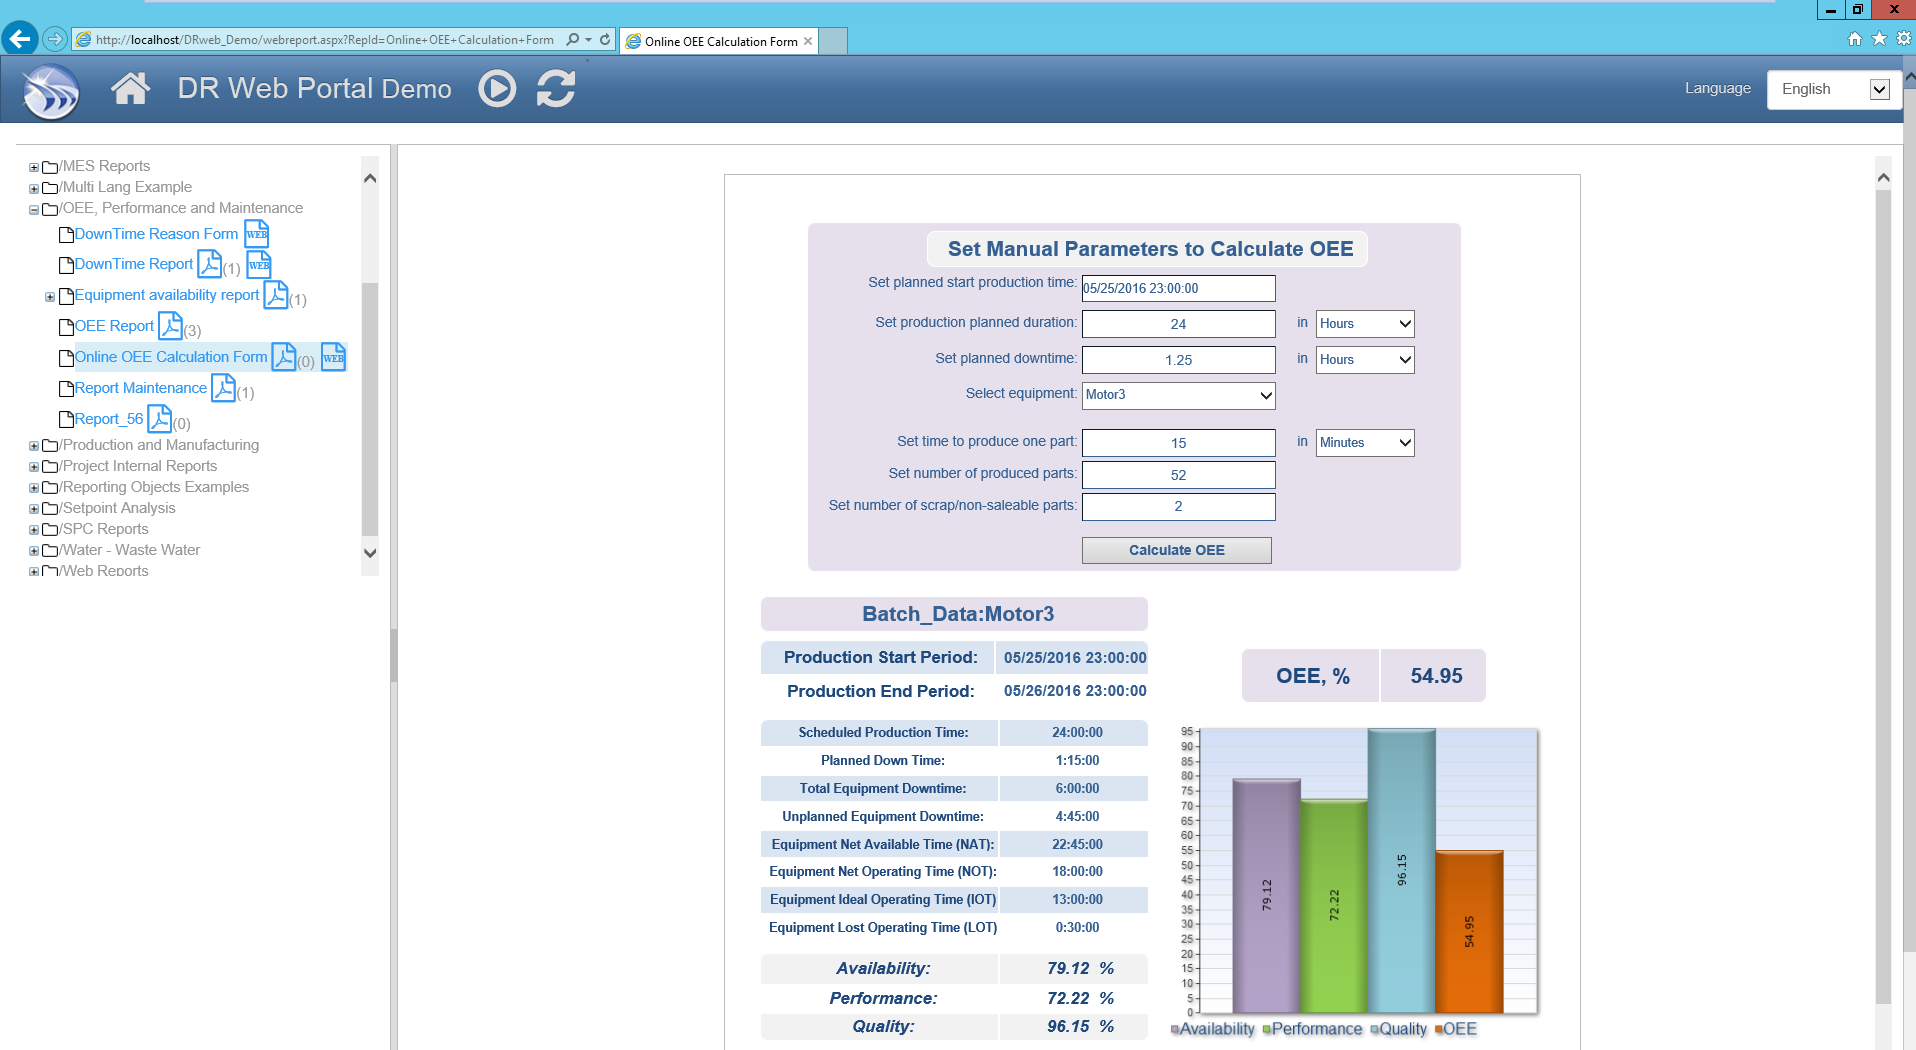
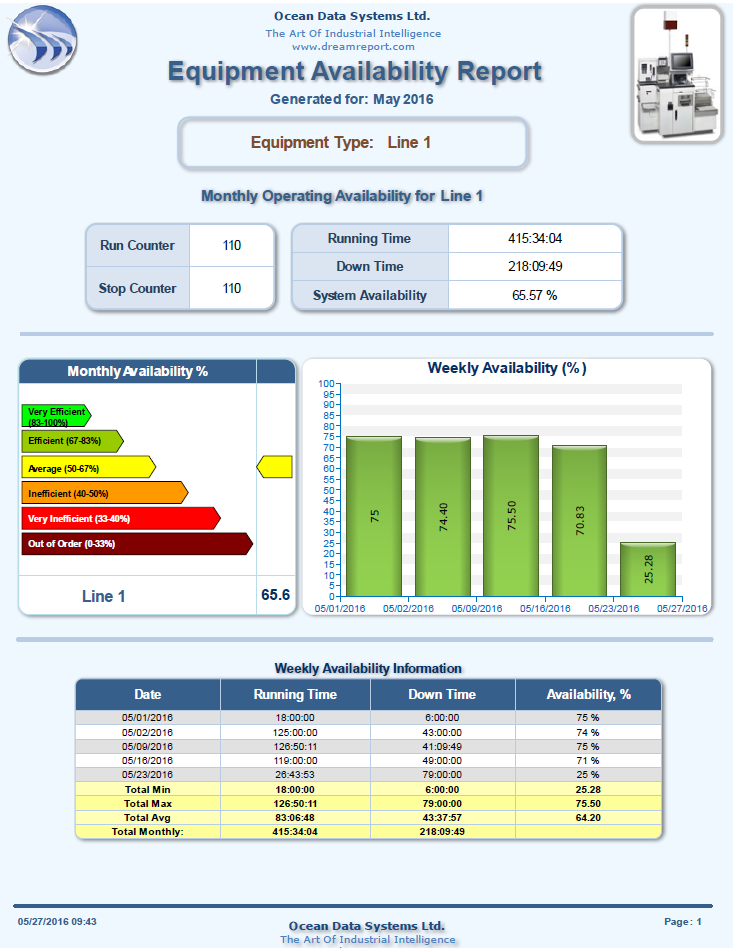
- Use Dream Report’s built-in “Availability” statistical function to calculate availability – (Net Operating Time/Net available Time)*100%. This is calculated by simply referencing a machine “status” bit, and setting a time period, and Dream Report performs the calculation. You can also apply a “filter” to the raw data to only calculate Availability under certain conditions – e.g., only calculate when the line speed exceeds a minimum value.
- Use a Dream Report “Expression” object to calculate Performance %. The “Ideal Operating Time” component for Performance might be available as a database lookup, a setpoint parameter on the HMI Or PLC, or manually entered by the operator (which is possible in Dream Report through a simple web form on the Dream Report Web Portal.)
- Use a Dream Report “Expression” object to calculate Quality %. It is common practice to assume 100% quality, but this number could be calculated from electronically-available data, or manually entered.
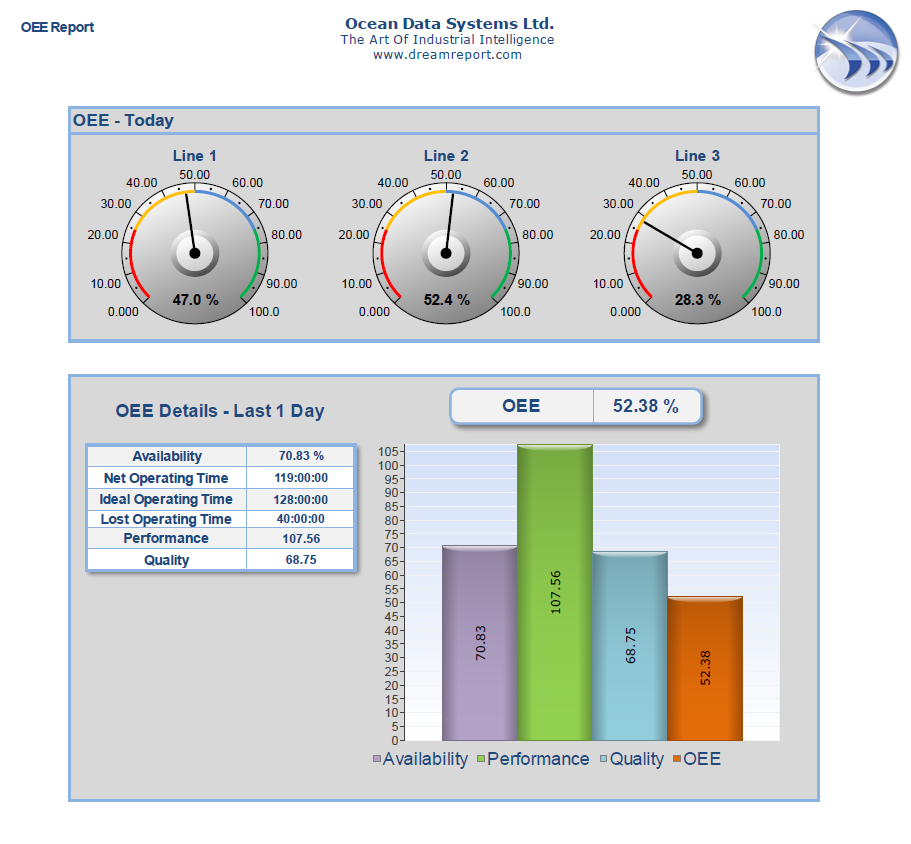
- With the three OEE component values calculated, the OEE will be calculated in any object in Dream Report. The resulting value can be shown as a single numeric value on a report; as a graphical display (e.g., an OEE gauge or indicator with color-coded OEE “breakpoints”); or in tabular format (e.g., a table showing OEE by shift for the current day.)
- Lay out the report as needed
Overall Equipment Effectiveness Reports can be automatically generated on a schedule (e.g., at the end of each shift), on-demand, periodically updated on a web portal (e.g., have an OEE web report constantly displayed, and set to auto-refresh every 10 minutes) or even triggered (and emailed) under certain conditions (e.g., when the calculated OEE drops below a specific value).
The following are a few OEE and availability reports. Remember, in Dream Report, you can configure and layout a report in any format, as needed.