
Dream Report version 4.72 is another great step in our product evolution. It delivers a wide variety of features, something for everyone.
Main themes for this release:
- Access to more information, instantly via the Web Portal
- Dream Report Objects get more powerful and flexible
- Universal Templates for Water and Wastewater
- New Driver Support – Access to High Level Objects from third-party products
- Lots of additional enhancements based on customer requests
Drill-downs & Raw Data Hyperlinks
Linking one set of results to additional information with a single click is one of the most important ways to achieve a deeper understanding of your processes and validation of your metrics. That’s called a drill-down. Dream Report offers drill-down reporting in a number of ways. One report can simply link to another report and pass parameters for Date/Time/Batch/Tags, etc. This is extremely important for linking disparate information – for example, this report is one part of my process and let me see another part at the same time or over the same batch. One click and you call the other report and pass parameters. In version 4.7R1, Dream Report was enhanced with Raw Data Hyperlinks, the ability to click on Single Data Objects and Trends for example, and see the data behind the calculation. If the KPI looks off, see a table or trend of the background data to understand why. In version 4.7R2, we greatly enhanced both Raw Data Hyperlinks, expanding that functionality to many additional objects, as well as introducing Hyperlinks to the powerful SQL Table.
The SQL Table has been enhanced with two types of Hyperlinks. One Hyperlink calls another report and passes parameters to it. The second, a Raw Data Hyperlink, calls the SQL Query of your design to display a popup of results. This becomes a custom Drill-Down function specific to your application needs. Any SQL Hyperlinks can also select other columns from the Row for the purpose of defining parameters for the Drill-down.
Water and Waste Water Application Universal Templates
 In the world of Water and Waste Water reporting; no two reports are alike. That’s a problem as it means solution customization to meet each installation. While the final outputs may look similar from region to region, even site to site, the data sources and calculations will vary with each installation depending on HMI, SCADA, Historian of other data repositories in use. That becomes a major challenge in the delivery of a “Standard” solution. Yet companies do claim to offer templates, along with customization services. In actuality, the major effort isn’t in connecting to a data source, or formatting the final results. The greatest challenge, and the most significant learning curve with any product, is in the area of statistics, the calculations required to get to the end result.
Standardized water and waste water reports have finally been delivered through the addition of “Universal Calculation Templates” for reports and dashboards, in Dream Report. These Universal Templates deliver example calculations that are needed to fill out any water or wastewater regulatory compliance Report. If there’s something special that you would like, we can easily create more and you only need to ask. These guides make report development fast and easy. The generation of an automated monthly operating report can now be measured in minutes rather than days. Simply copy and paste the supplied templates and edit them for your data sources and desired presentation.
Reports vary widely and regulatory agencies typically offer their own templates for the purpose of reporting. These templates (often Excel Workbooks) are filled in and sent to the agencies or they can generate electronic outputs and upload them to online systems (eDMR, eDWRS for example). This requires a solution to be able to acquire the raw data from any variety of data sources, perform the required statistics on that data, format the results for proper presentation and then place those results into the agency or other templates. The new Dream Report Universal Calculation Templates, along with standard Dream Report functionality, delivers exactly that functionality; communications connectivity to acquire data, the Universal Calculation Templates that deliver sample calculations and formatting, and then the Dream Report standard features are used to either report the results in a PDF file or place the results into existing EPA provided Excel templates.
 Next Generation of Information Access
Dream Report integrates with a very wide variety of products. In most cases, Dream Report will query third party systems for raw data to be used in Dream Report statistics and presentations. Some third party products deliver advanced results, in final display form, to be used in reports and dashboards. Dream Report plays the role of an integration, formatting and delivery solution in addition to being a data query and statistic solution. This is especially true of the GE SmartSignal Predictive Analytics Software. Dream Report now has the ability to request statistics and final data representations from the GE SmartSignal solution and incorporate those results, final graphic files, into Dream Report reports and dashboards. The work performed for this specialized access will be used in the future for connectivity to other advanced analytic solutions.
Customer Requested Enhancements
Web Portal Slide Show 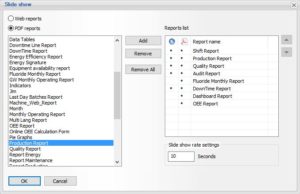 – Now you can select a set of Web Reports and have them automatically transition from one to the next in a Slide Show fashion. This is great for corporate dashboards that may display information by department or product line. Simply set the show up under Web Portal configuration and Turn it on in the Web Portal. Added bonus, you can stop the slideshow at any time and access the report on display for further processing.
Web Portal Automatic Replay – If you have the need to find information either based on raw data or Dream Report statistics, you may now replay a Web Report over a period of time. Let Dream Report sift through your data, perform calculations and display results. You can set the time period and refresh period and you can watch while Dream Report generates your results. See what you need? Stop the replay and take action with the report you’ve configured.
SQL Table New Features – 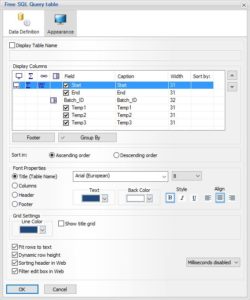 Dream Report has major changes to the SQL Table. These include the ability to add calculation columns and hyperlinks on column data. Dynamic row heights show variable amounts of wrapping data in a SQL Table.
Raw Data Features – New Raw Hyperlinks in the Draw Table Object, Pie Object, Bar Object. Raw data may now be copied directly to the clipboard in addition to being exported to a .CSV file.
DBatch User Interface – DBatch stands for Dynamic Batch – the ability for Dream Report to report on event based periods with variable start and stop times (typically called Batch processes). This powerful feature has received numerous internal updates for flexibility and reliability.
Web Tree Control – This object displays the data sets based on a Tree, Branch and Leaf architecture (Data Models in the automation world). Selections may now be made for entire Branches and associated Tags and not just at the Tag level.
GE Proficy Historian Quality – In the past, Dream Report quality checking has been limited to good or bad. Some products like the GE Proficy Historian can return a variable quality in the form of Percent Good based on variables that may be used in an aggregation. Dream Report now offers the ability to set the level of permissible quality to define a Good Quality.
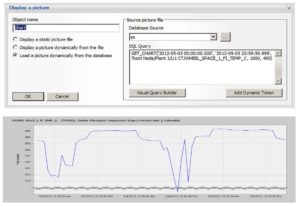
GE SmartSignal –  New History Data Driver and advanced object driver. The new driver enables Dream Report to communicate with the Smart Signal data system, retrieve historical values, images, pictures, charts and use those in reports.
Wonderware Intouch – New .ALG (Historical Alarms Driver). Dream Report can generate awesome alarm statistics. These now apply to alarms from Intouch repositories.
Percentile Statistic – Dream Report will now calculate the Percentile of a variable in a data set. Percentile is a measure used in statistics which indicates the value below which a given percentage of observations in a group of observations fall. Dream Report supports 3 ways of percentile calculation: the nearest rank method, included and excluded methods.
Milliseconds – Dream Report gets involved in some pretty interesting applications. Some of those applications require an analysis of data down to the millisecond. Now Dream Report delivers. Many drivers support milliseconds and dream report objects also support millisecond based data.
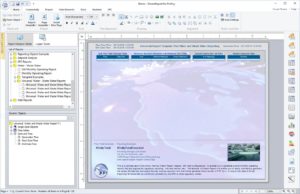
Fresh New Look – Have another look at the Dream Report Designer Studio image above. You’ll notice a new “Flat” Visual Theme has been added. In addition, many of the menus have been updated with a more current user interface to enhance the ease of use and make Dream Report even faster to learn and apply.
