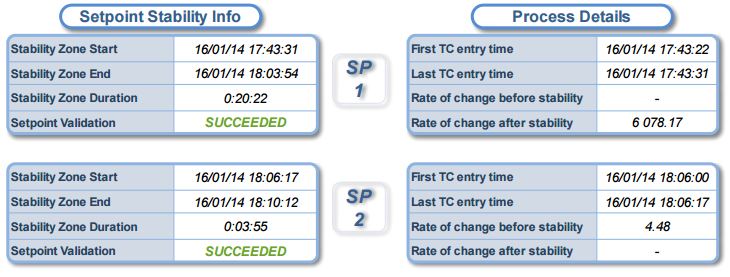
Thermal Setpoint Analysis (for Thermal Uniformity Surveys)
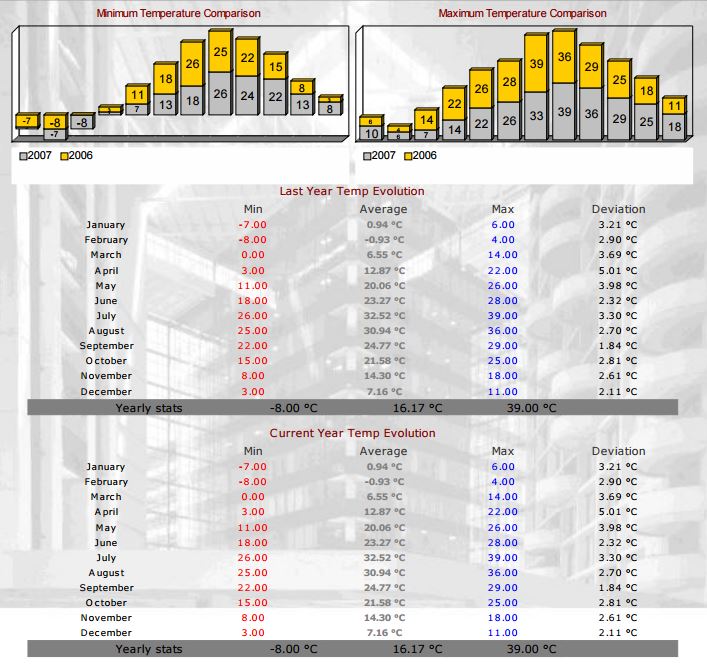
Year over Year Comparisons

If you have an HMI/SCADA, you have a Real-time View and you have a Control View. What’s missing from most automation systems is a tool that delivers your Statistical View. Without a Statistical View, you’re missing the most important tool to help drive continuous improvement.
The focus of HMI/SCADA
HMI/SCADA systems are optimized to monitor and control your process. They are a real-time and interactive interface to the process for your operator. HMI/SCADA solutions are not optimized to analyze large sets of data, turning that data into relevant KPIs. Moreover, they are not good at delivering information to all those that need it. They are designed to respond to an operator’s queries and commands not leverage email, FTP and various file formats for information delivery. To have a Statistical View, you need a report/dashboard solution as part of your automation system.
The focus of a report/dashboard solution (Statistical View)
A report/dashboard solution is optimized to query large sets of data from your various repositories, turning that data into the information that you need to understand, to then control and optimize your processes. A report/dashboard solution will automatically generate the information and will then deliver that information to those that need it. It will email information, FTP files to remote locations, will print results or save results in PDF, CSV and Excel file formats to make that data as actionable as possible. It can even write values back to your HMI/SCADA, driving action at that level. A report/dashboard solution will also manage that data for you, organizing past results for quick and easy retrieval from a browser, tablet or mobile device. Considering the amount of data report/dashboard solutions will work with, it’s natural to understand that these statistics can’t run in real-time. They often need several minutes to compute and organize results, but these computations are performed in the background, with CPU priorities set so they don’t impact your real-time systems.
Markets vary
Your Statistical Views will depend in the market that you’re in. In the world of water and wastewater, you may want to monitor equipment operation, cycle times, total running times, pump performance over time. You’ll want to compare filter bed performance to that of the last backwash cycle, or one from a month ago. Differences should be automatically calculated and highlighted. Hyperlinks should enable drill-down views of the data sets that make up calculations. Of course, there are the standard monthly operating reports that are required for EPA compliance.
In the world of Life Sciences, you are concerned with golden batches and comparing current production to the ideal. Variances need to be calculated, understood and managed. Equipment performance monitoring is valuable to reduce the risk of failure. Batch quality reports are required to release product for delivery. Extra care needs to be taken to meet FDA regulations – 21 CFR Part 11 record keeping.
In industries that have thermal processes, heat treating in aerospace and automotive, sterilization processes in food and pharmaceutical, you have the requirements to analyze temperature profiles (setpoint analysis) to ensure the conformance to standards in both temperature deviations and time at setpoint.
In building automation, you’re looking to meet the guidelines of Leeds or EPBD. You want to compare energy costs year over year and verify that automation components are running at their optimum.
Your Statistical View solution
Once you acknowledge the benefits that may be derived from a Statistical View, you’re faced with how to accomplish the task. While it’s always possible to throw money, time and technology at any problem, crafting a solution to your liking with business tools such as Excel, Crystal Reports for Microsoft SQL Server Reporting Services (SSRS), it’s better to select a solution purpose built for this application and delivering the ease of use and reliability demanded by this market. A purpose built solution delivers the lowest long term cost of ownership and achieves the reliability and ease of use that is expected in this market. That’s where Dream Report becomes a unique solution. There is no other solution that enables a Statistical View, designed specifically for the rigors of the industrial world, which meets all your requirements for compliance reports and performance dashboards.
Sample Statistical Views
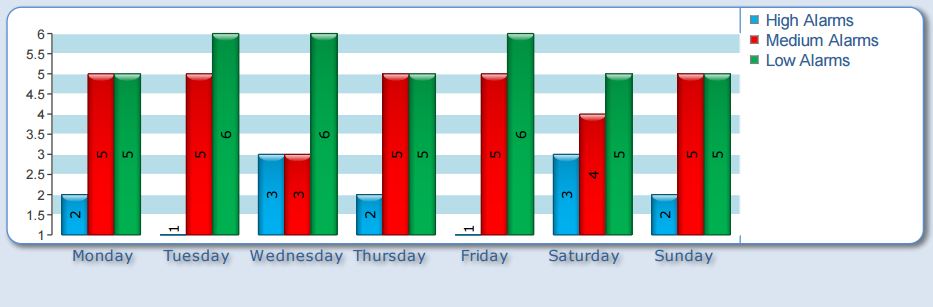 Alarm Analysis
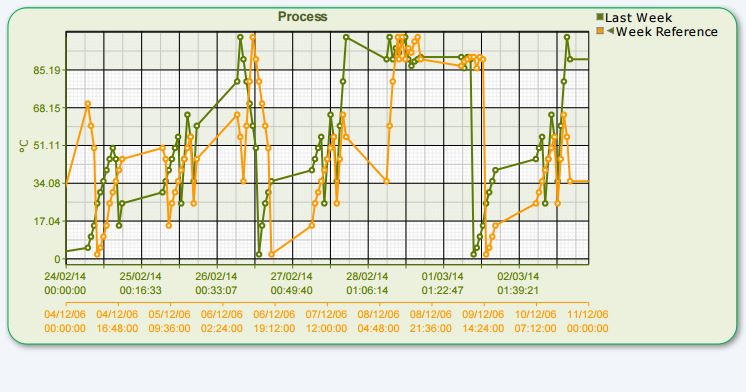
Week over Week Trend Analysis
Thermal Setpoint Analysis (for Thermal Uniformity Surveys)
Year over Year Comparisons
