
 It’s been proven that regular and even automated performance reviews will drive focus on key initiatives and will drive continuous improvement. This is true of personnel reviews and for the monitoring of your key assets. One of the most important factors in achieving understanding is the display of your result in the most meaningful way. That may be as simple as a single grade, or enhanced through a grade and visual indication of how items compare.
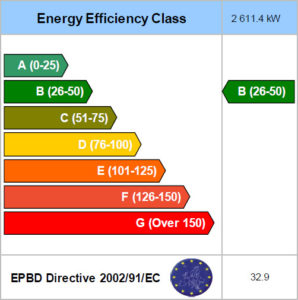
This powerful performance object, created to support the EPBD (Energy Performance of Buildings Directive), enables the meaningful display of your building’s energy performance, to meet the legislation first published in 2002. http://www.epbd-ca.eu/ When coupled with Dream Report energy calculations and report and dashboard capability, it becomes the key object representing any number of Key Performance Indicators (KPIs).
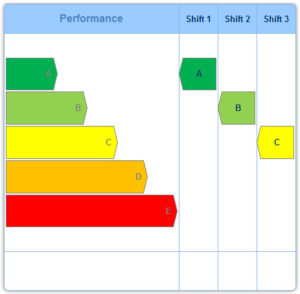 This object carries with it a great deal of flexibility, the capability to represent any number of scales and color coding with one or more indicators. Hence performance can be displayed for multiple assets, or multiple shifts, all with-in one object.
So go ahead – Display your:
- Building Efficiency
- Equipment Performance
- Product Reject Rate
- Shift Production Performance
- Profit Margins
- Energy Usage
When displayed and accessible by your key stakeholders, and reviewed regularly, you’ll be amazed how quickly your key metrics will improve.
