The Dream Report name conjures up the idea of document generation. While that’s an important capability, Dream Report delivers a powerful and interactive Web Portal. This portal can be applied to many things, but with the right computing hardware, and a flat-screen TV, you have a wonderful KPI Dashboard.
The Dream Report Web Portal is based on HTML 5, today’s leading interactive web technology. As Gartner put it, “HTML 5 will be an essential technology for organizations delivering applications across multiple platforms.” Dream Report has it today and supports IE, Chrome, FireFox, Safari on both full PC platforms and Mobile Devices. The latest operating systems and mobile devices are all HTML 5 compliant.
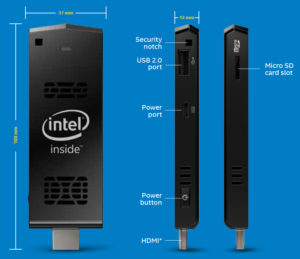
 The Intel Compute-Stick is a relatively new device on the market that delivers a complete computing experience with typical PC horsepower combined with Bluetooth, WIFI, USB, 2GB Ram, 32 GB Storage and an HDMI output to drive a TV. All you need to add is a keyboard and mouse.
Click here for details on the Compute Stick.
The Dream Report Web Portal manages your existing documents, enables you to trigger the generation of new documents and provides a completely interactive “Web Based” display of data with the ability to make date/time, list box selections, perform manual data entry and perform push button actions. This enables the user to select times or conditions of interest, and then interactively generate the reports they want.
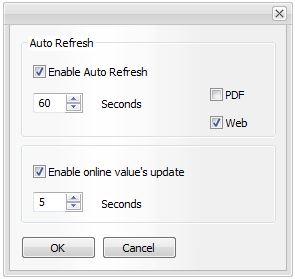
 Dream Report also gives you the ability to create a fully automated report that is refreshed at an interval that you specify. There are two types on information that may be included in a Dream Report real-time Web Report, real-time links to external data (current data connections) and links to real-time statistics, calculations performed by Dream Report. Each offers a selectable refresh rate. Real-time external connections, “On-line Values,” will access the inputs from Dream Report real-time drivers. This refresh rate would typically be in the “Seconds” range. Statistics are the calculations and advanced presentations that Dream Report will perform (Calculations, Trends, Tables, etc.). These are obviously more compute intensive, selecting a month, day, shift or batch of data and then computing and presenting relevant statistics. Refresh rates for statistics should typically be in the tens of seconds or “Minutes” range, depending on the levels of analysis that you’ve set up.
Displaying this on a large display will simply entail acquiring a suitable flatscreen TV, the Intel Compute Stick to access the Dream Report Portal (with a dedicated logged-in user, if Dream Report security is enabled). You’ll need to be sure the web portal offers an extra concurrent user license for this dedicated user.
The result is a powerful and user defined image of your most important KPIs. Interested in continuous improvement? Dream Report is the best way to keep your team up to date with process goings on, through real-time dashboards and through the automated delivery of reports.

