Dream Report 4.6 is Available for Download!
Dream Report version 4.6 delivers vast improvements along a number of themes. These themes include:
- MES Reporting
- Life Sciences
- Connectivity
- Just more Awesome Stuff
This release is coming out in two parts, R1 and R2. We have some key customers that just couldn’t wait for some of these features, so we rushed R1 out the door for them. Release 2 will be coming out next month, and will deliver our Life Sciences improvements and some additional connectivity (among other things – stay tuned).
Theme – MES Reporting
Dream Report has long been known as a powerful report generation product oriented to the plant floor and reporting from automation data sources like historians and HMI/SCADA. You may also know that Dream Report offers SQL Query capability, and you have enormous capability if you are a SQL Guru. Well, now that power is in the hands of mere mortals. Dream Report now includes a Visual SQL Query Builder, and the ability to create and save Queries to a Library for reuse in projects. The ability to include Dynamic Tokens in queries makes their reuse very easy.
There is also a new MES Pricing Option. Dream Report pricing is scalable in a couple of dimensions, the number of Tags (Data items) that you collect and use for your reports. We don’t count how much you use them in reports, but if you are connecting to 100 data variables in your automation system, then you will need to purchase at least a 100 Tag version of Dream Report. We also scale pricing based on the number of Concurrent Web Portal users. As we get more involved in “Business Class” reporting, and reporting from data in SQL Databases, counting Tags for Database Queries becomes tedious. So, to solve that, we’ve introduced the Dream Report MES Option. If you purchase this option, then you have UNLIMITED SQL Query capability and we’ve thrown in an additional 5 Web Users for good measure.
Just one more reason to standardize on Dream Report across your entire enterprise!
Theme – Life Sciences Features
While most functionality that we deliver in Dream Report applies to most of our served markets, some markets benefit more. Release 2 will deliver Electronic Signatures with Report Approve or Reject functionality, F0 (Lethality Calculations), and Audit Trails. There is also a Life Sciences Option Price to enable these special features. Dream Report already offers version management for reports. This release also delivers new Project Deployment tools, making the management of a large number of applications across your corporation a snap. You can read more below…
Theme – Connectivity
Our partnerships continue to expand and so do our options for data connectivity. This release delivers connectivity for:
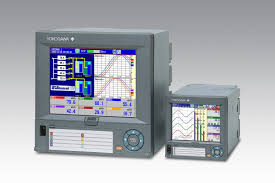
- Yokogawa Recorders DX-FX-GX – Now Dream Report can be your long term archiver for recorder data, and you have lots of specialized report functions, for example – TUS (Thermal Uniformity Surveys) Reports. Dream Report is also great for energy accounting, EPA Reporting, etc.
- Wonderware IntelaTrac – MES Reporting based on IntelaTrac as the data source is being done with Dream Report at some of the largest petrochemical companies in the world.

Theme – Just More Awesome Stuff
Reports are even more BEAUTIFUL – New Display Objects, Shadows, Rounded Corners, Background Images are just some of the features that make our already beautiful reports even more stunning.
The Web Portal is even more interactive than before. We could already trigger reports, select batches – dates – times – etc. But now we can interact with reports that are generated. You can Pan and Zoom Trend Charts, add pens and remove pens. You can also search and sort tables of report data.
Dream Report – There is no substitute!
Have a Look at the Full List of Enhancements and New Functions
(For more details, please, refer to the Dream Report® help documentation and release notes)
New 3D Graphical Engine
Dream Report 4.6 has a completely new graphical engine, which generates graphics and creates PDF and web reports. The new graphical engine also provides users with controls on object properties like shadows, rounding corners (selectable), which enables users to create pseudo-3D graphics in reports.
Pivot Groups
The Pivot group is a new option, which can be applied to any object or group of objects. The user can define a rule, that will control the multiplication (replication) of the objects.
Example: Build a chart for each day of the previousweek. Or build a table and a chart and data objects for each phase of the last batch. Or build a table for each product type, found in a database. The objects group multiplication rule can be set using a time or a batch definition or by a SQL query or by a stored SQL procedure.
Deployment Package Tool
The Deployment Tool is a great solution for system integrators, that can save a lot of the time while at a customer site. It enables users to automatically generate either an initial package, which is an EXE file, that contains a Dream Report product installation and the complete project. The user can launch that package file and it will automatically install Dream Report, install its project and run that project. No training or special instructions are required.
Alternately, users can generate a project update package which will generate an EXE file, that includes only updated files of a current project. When the user runs that file, the package will stop currently running project, update the project files and restart the project. No user interaction is required.
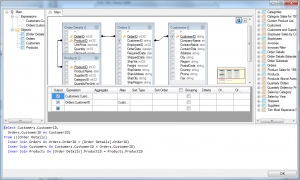
Visual SQL Query Editor
The new module “Visual SQL Query Editor” allows users who are not very familiar with SQL language, to connect to a user’s database, get a visual browse of all database tables and views, and then create links between tables and select columns, all through the use of the mouse. Even for those who are SQL experts, the visual SQL query editor will save a lot of engineering time while building SQL statements.
New SQL Query Table
Dream Report 4.6 has a brand new SQL table object. This object enables the user to predefine the number of columns for complex queries and stored procedures, and pre-adjust column widths. Users can also use standard advanced visualization tools, i.e. to change color/size/style of text font or background color in a table cell, depending on the result. Users can also define a multi-line footer with the overall total calculations.
SQL queries can be built and edited using the visual SQL query builder.
SQL Query and SQL Stored Procedure Support in All Reporting Objects
The SQL query function is now supported in all statistical objects, such as: SQL table, Single data object (SQL query function), Pie graph, Bar graph, Chart and an action button. This means that each of those objects will support a SQL query or SQL stored procedure.
SQL Query Manager
The SQL Query Manager is a new module that is a central location, used to define SQL queries in a project. Users can define complete queries or any of their parts and then use those queries in reporting objects. The benefit is that when a query is used in multiple objects, user can modify the query in one central place (SQL query manager) and it will automatically be applied in all places, where the query or its part is used.
Execute SQL Query Function in Web Action Button
The Action button has a new action function: “Execute SQL query”. It enables users to specify a SQL query and then execute it on a button click in a web report. This function enables users, for example, to build a manual data entry form in a user-friendly and easy manner, and then using the “Execute SQL query” button, write manual data into a custom database/historian in a custom required format. The SQL query can use any simple reporting object as its input parameters.
Interactive Web Tables
Each table object, when displayed in a web portal, is now an interactive web object. The user can dynamically sort a table by columns, online, just by clicking on a table header. A user can also expand/collapse a table and it’s also possible to filter a table online. There is a filter area in a table header, so the user can enter keywords in a filter and the table will be filtered by entered keyword in that column.
Interactive Web Trends
The Chart object has a new option: “Interactive web trend”. If this option is enabled, the trend will be displayed in a web report as an interactive object. The user can zoom in and out on the data by selecting zoom area or the entire trend. The user can also switch lines on and off, see values and their respective timestamps in a tooltip, and drag the chart area.
Real-Time Values Display in Web Portal
The user can specify single data objects with “Current value” statistical functions on a web report (not PDF or Excel). The web report will update the values of those objects in the web portal without refreshing the entire page. Users will see real-time value updates directly on the screen.
New Options in the Time Picker Web Object
New options in the time picker web object allow users to add time pickers with different visualization and different time selection options. In addition to using absolute time, users are now able to add a time picker with fixed time selection (e.g. Last 2 days, or current month…)
Fully Customizable Skin and Logo in Web Portal
If the user wishes to customize a logo image in a left upper corner of web portal and/or modify the skin color (theme), used in a web portal –there is now a user-friendly way to use a custom logo and custom theme image. The user can open Project Settings è Web configuration window and in the custom settings section, the user can browse and select an image for logo and/or an image for web portal theme.
Private Code Lockable Report Templates
The user is now able to design his report, save it as a report template and lock the report template by a developer’s private code (password). If anyone tries to load that report template in Dream Report designer studio – the template will prompt for the code and won’t be loaded without that custom code. The template can be sold or just be protected from unauthorized use by that custom code.
Multi-Tag Aggregation Formulas
This new function enables the user to create definitions, which can be an expression, calculating values from multiple tags. The expression can be used as input data for statistical objects.
Example: Build a chart on expression ((Tag1 + Tag2 + Tag3)/3) for the last day…
New Options in Aggregated Data Filter
The Aggregated Data Filter has new options, which allow users to select an approximation method and align calculation period to the period of the object, where that aggregated data filter is currently used.
Example: Build a chart straight line for the average value over the entire chart period. Or get 10 key values over the object period.
New Statistical Functions (Smallest, Largest)
New statistical functions (Smallest and Largest) are available in the statistical functions library list. Each of those statistical functions has an input parameter (argument) – the array element number. Then, each of those statistical functions will calculate the smallest or largest n element of the input (extracted) values array. Those functions work in exactly the same manner as they work in MS Excel.
Multi-Spreadsheet Support in Excel Reports
The Export to MS Excel wizard now allows users to select or set which Excel spreadsheet to export report data into. In previous versions only the first spreadsheet was available for data export. Now it’s user-configurable.
CPU Priority Management
The CPU priority management option enables users to set custom CPU priority levels (out of 5 available) for data logger and/or report generator services. Default CPU level is always set to “Normal”, so users can increase or decrease CPU level for Dream Report processes at any of 5 available levels (Very low, Low, Normal, High or Critical).
New License Types (MES, Life Sciences and Redundant license options)
Dream Report 4.6 has new license options available:
- MES license option – this option provides unlimited SQL statements in any objects throughout the entire project and 5 additional concurrent web clients for the license.
- Life Sciences license option – this option enables 2 functions that are critically important for Life Sciences area: Electronic signature and F0 calculation function (for sterilization process validation). Those two functions are not available in a standard license.
- Redundant license – this new license type can be used only on a Dream Report server that is used as a redundant server paired with a primary one. This license will be accepted by Dream Report only if a Dream Report project has the “Backup” option enabled in its Project Settings and main server is valid.
Data Logger Enhancements (Normalized log time and %-based tolerance)
New options in the data logging group configuration provide better flexibility in data logging configuration.
The Normalized Log Time option enables users to define periodic data logging and link logging time to round absolute time. Example: If the user sets the logging period to 15 minutes, data will be logged at each round hour (00 min), xx:15, xx:30 and xx:45 minutes of each hour.
%-Based tolerance option enables data logging on change with tolerance set in units or in %.
Object Configuration Tool-tips
As an additional tool to facilitate editing a Dream Report project, the user can keep a mouse over any statistical object for 1-2 seconds and a tool-tip with the object’s configuration will be displayed. This option is tunable and a user can switch it off (using a “Tool-tip” button in the ribbon bar).
New Report Settings Options (Show report in a list, Load report)
There are two new options in the report settings:
- Show report in a list option defines if the report will be listed in the reports list of the run-time window, dynamic report generator and web portal. If this option is disabled, the report will be visible as usual in the designer studio, but will be hidden in the list of reports in a web portal, run-time window (RMC) and in the dynamic report generator window. However, this report will be loaded and running in a run-time project as usual.
- The Load report option defines if a report will be loaded in a run-time. If this option is disabled then this report will be loaded and displayed as normal in designer studio, but will be not loaded in a run-time project and therefore will be not displayed in the report list in a run-time window, dynamic report generator or in a web portal.
UTC Timestamp Support in Batch Definition
If batch information is used in a Dream Report project, and a user is retrieving batch information from external database, if batch related time stamps are in UTC format, the user now can enable the option “Use UTC time format” and all requests for batch information and all retrieved time stamps will automatically be converted to/from UTC/local time accordingly.
Selectable Designer Studio Themes
The Dream Report designer studio, in previous versions, has a blue theme (MS Office 2007 style). Dream Report now offers users the ability to select the desired theme out of three available themes (Blue, Silver and Carbon). The Carbon theme is the default one. Themes can be switched through a drop down list in the right part of the “Home” ribbon.
New Graphical Controls (shadows control, rounding corners…)
There are new graphical options in the Designer studio that allow users to tune up and enrich the look of each object.
A Shadow control allows a user to draw an object shadow, select shadow’s direction, intensity depth, color and distance.
A Rounding corners control allows users to select any object and change the corner rounding parameter. This parameter enables users to set rounding to any specific corner of an object.
New Object Display Options (show on each page, lock object)
A new object display option allows users to right-click on an object and set it to be automatically displayed on each page of that report. Another new option allows users to right-click on an object and to lock it at its place. If this option is set, and if the object has an expandable table or another dynamic object above it, which can move the object at report generation time then all object position dynamic shift will be disabled and the object will be locked at its original place, and all external calls to dynamically position shift will be ignored.
New Drivers
Advanced ODBC Driver – A new advanced ODBC driver provides an advanced way to get automated data access from an external database (e.g. MS SQL Server or Oracle or MySQL or MS Access). The new driver enables either define links between multiple tables (using visual SQL query builder) and map data retrieval from multiple tables, or write a custom SQL script to retrieve tag browse and then retrieve values for requested tags.
Yokogawa Recorders Historical Files Direct Access – A new driver to Yokogawa recorders enables access to binary files, generated by Yokogawa recorders. Data access is enabled for both DX, FX and GX recorders series, both to regular files and validated files.
Wonderware IntelaTrac Driver Enhancement – New properties are available / accessible in the new Wonderware IntelaTrac driver.
###