December 2015 will represent a significant time for Dream Report. It’s the time that we introduce Statistical Process Control functions, and open up vast new markets for Dream Report to address. There are many other enhancements, but SPC is by far the most important and exciting.
We’ll focus on SPC in this announcement. Following announcements will deliver detail on our other significant enhancements. Overall, Dream Report 4.7, our December 2015 release, will deliver:
- NEW – Statistical Process Control (SPC) reporting functions.
- NEW – Data Modeling, the ability to organize Tags into Areas and Assets
- Updated – Runtime Management Console – New look and feel. New Active-X Control
- New and Updated Drivers
- New OPC UA Real-time Driver
- Updated Citect Drivers – Working with Citect and exploiting native APIs
- Updated Yokogawa Drivers – Working with Yokogawa to support GX Multi-Batch
- Major Object Updates
- Update to Table Footers – Change Orders
- Vertical Orientation of Charts
- Many minor changes – see release notes
- Web Report Enhancements
- Multi-line Web Edits
- Checkbox Selection Item
- Unique Tag items in Combo-Box
- Tree Objects to Display Tags
- New License Models and New Pricing Options
This post will focus on the Statistical Process Control (SPC) Reporting features of version 4.7. Future postings will detail the additional features in our coming 4.7 release.
Statistical Process Control (SPC)
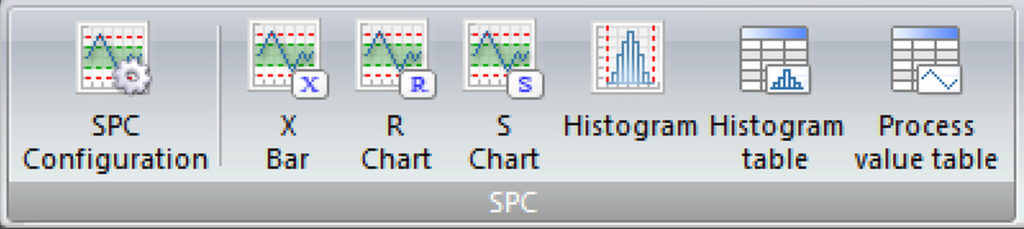
Dream Report now includes the ability to define Statistical Process Control functions. Designed for ease of use (as always), Dream Report enables the user to quickly and easily define the variables to use and the calculation rules to apply. The user then selects the various output formats with which to display the results in a report document or an online Web report. Display objects include X Bar, R and S Charts, Histogram Chart, Histogram Table and Process Value Table.
It starts with the SPC Variable Definition. This selects the tag for analysis. You may select time based or sample based analysis. You may define fixed specification limits or variable limits.
Then, these SPC calculations offer display in a variety of ways, using X Bar, R and S Charts, Histogram and result Table outputs. Visualization includes data interpretation and visualization based on the 8 Nelson Rules. A table output delivers the ultimate detail in samples and statistics.
Stay tuned for more information in the coming weeks.