Water and Waste Water Example Templates for EPA Reporting
There are three reasons Water and Waste Water customers want a solution like Dream Report.
First, there are reports mandated by regulatory agencies. This requirement is the most likely driver of Dream Report selection and the Water and Waste Water industry is by far the most regulated in this respect.
The second driver for information comes from the need to generate information that helps you run your plants better. These can be reports about equipment operation, energy or chemical utilization or maintenance. While Compliance information is mandated, the data you must have, Performance data is the real data that you want to have to improve your operations. The challenge has been that the tools to generate Compliance data have been very good at that, but not flexible or easy enough to apply for general purpose Performance data. As a result, the delivery of good quality and widely shared plant Performance information is typically lacking.
The third reason for information access is for troubleshooting. When numbers don’t look right, for either Compliance or Performance, you need the tools to perform ad-hoc queries of your data, to pan and zoom trends, search and sort tables and export data for analysis in other tools, possibly as simple as Excel.
Today, users are applying different tools for these three purposes. Dream Report is a purpose-built solution that delivers in all three areas, and having been though 10+ years of development and through 20+ version releases, Dream Report has been tailored for this market and is perfectly suited to all aspects of Water and Waste Water information management.
Report Templates Make Water and Waste Water Analytics Easy
Ease of use and flexibility means that those that need information can generate it themselves. That is the design goal of Dream Report. In the past, generating a report meant developing a specification, justifying the effort with IT departments or System Integrators and then iterating on the result until you get what you want. This process is both time consuming and expensive. This is the 21st century and with today’s technologies, there should be no need for programming or scripting on the part of the typical user.
Aside from getting the work done, that’s a major goal of Dream Report.
Templates Make Water and Waste Water Report Configuration Easy
Dream Report delivers templates for all the typical Compliance, Performance statistics and Ad-Hoc interfaces that you’ll want to create. These are included in the Dream Report Demo Project. Some run right out of the box with little customization. Others provide the building blocks for the development of your specific state or federal report. In either case, while Dream Report is developed as a general-purpose Report and Dashboard solution, rest assured that it can be quickly and easily configured to address your specific needs, even the specialized needs of vertical markets.
When it some to Compliance reports, formats will vary state to state and country to country. However, they all require the same calculations. These may be monthly tables of daily flows. Minimum daily chlorine residuals, time of the events, maximum turbidity, total monthly flows, etc. To make configuration easy, Dream Report offers a set of 4 Universal Templates that are examples of the most common calculations, and examples of how to perform virtually every required calculation using these simple objects. The objects in a Universal Template may simply be copied and pasted into your own report, and then be modified to point to your specific data sources and perform your specific calculations. These are fully end user configurable and no programming or scripting is required.
Universal Water and Waste Water Template 1 – Specialized Statistics
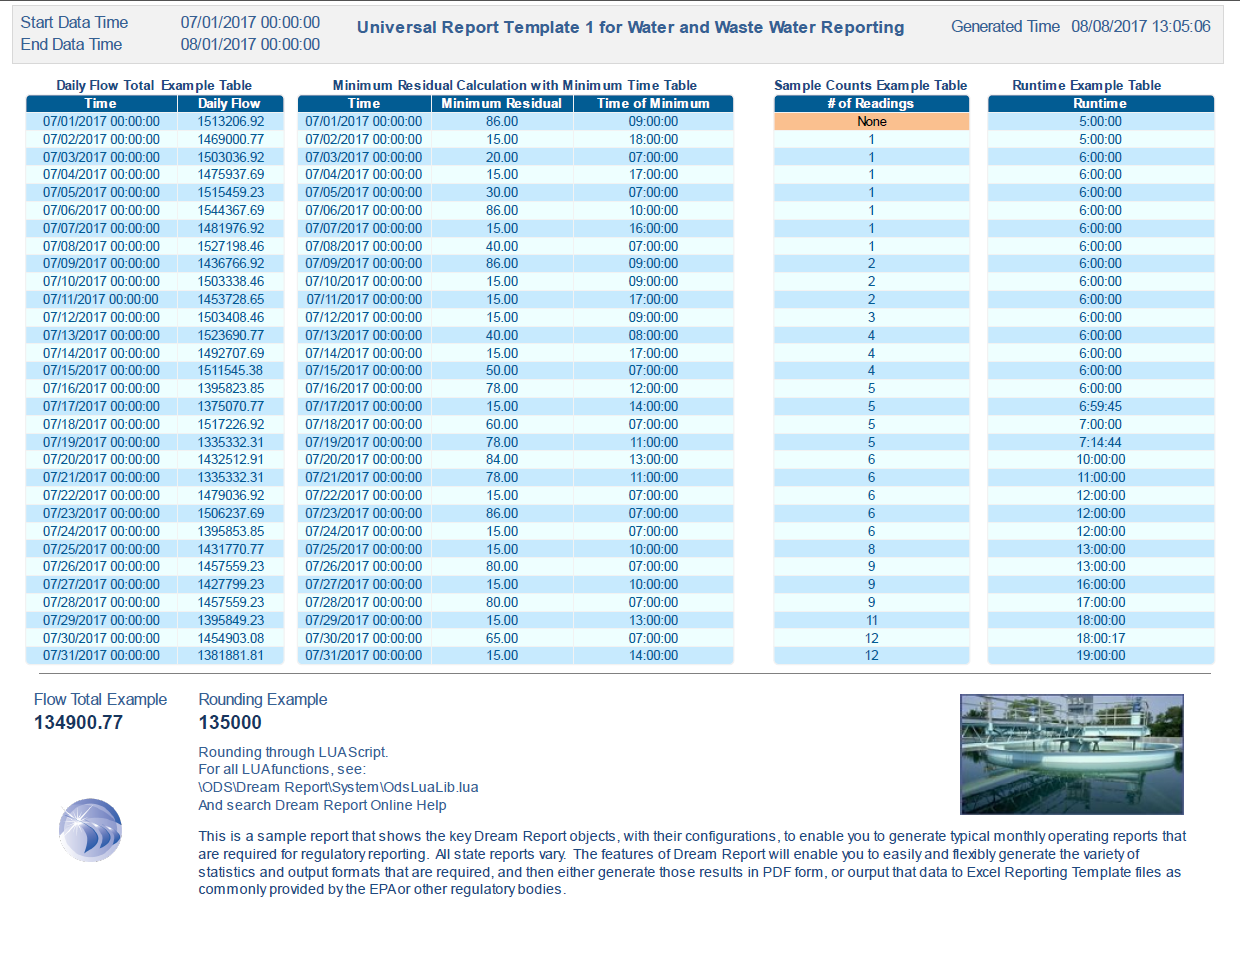
This template delivers examples of the most commonly used object for Water and Waste Water reporting, the Dream Report Step Table. The Step Table can query data over a long interval (time based or event based), and can then summarize that data based on a Step Interval. For example, a Step Table can generate a Monthly Table of Daily Summaries, a Daily Table of Hourly Summaries. But it can also do a Monthly Table of Events (for example, Backwash Filter Cycles or RO Media Tests).
In this Universal Template, you’ll see an example of a Monthly Table of Daily Flow Totals, a Monthly Table of Daily Minimum Chlorine Residuals and the Times that they occurred. A Monthly Table showing the number of Samples taken per Day and an example of a Daily Calculation of Runtimes.
Data may be represented in many ways. One table highlights advanced visualization that can color code results based on their value. This template also highlights an often-seen compliance requirement to round data results and shows how that can be accomplished through an advanced feature called LUA.
 Universal Water and Waste Water Template 2 – Data Management
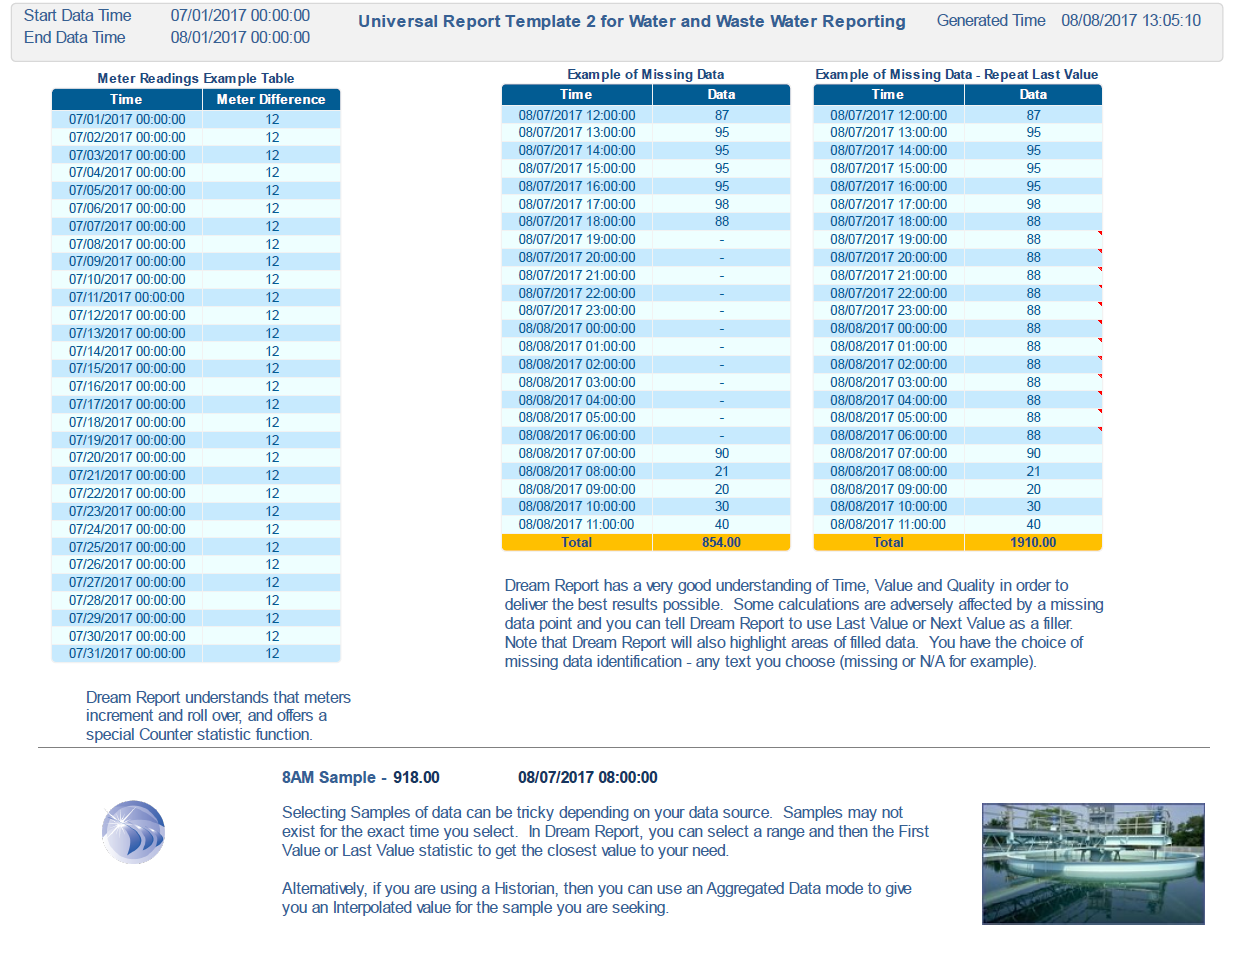
This Template expands on the use of Tables, and highlights two very important attributes of Dream Report, its specialized calculations, and its handling of Quality Flags associated with queried data. While Dream Report has all the functionality to address ANY calculation a Water and Waste Water application may need, there are some very specialized functions to make complicated tasks easy. Meter Readings for example, require the selection of the first value and last value of an interval for the calculation. However, Meters are often implemented in control systems that may have varying rollover points. A standard Meter may roll over at 999,999 for example, while PLC Registers may roll over at 16,384 or 65,535. The Dream Report Meter Statistic will take that into account. The first table highlights the use of the Dream Report Meter (called Counter) Statistic.
Industrial data sources usually accompany queried data results with Quality Flags. These Quality Flags enable Dream Report to handle BAD quality is unique ways. Dream Report will ignore BAD quality data in its Statistics. However, when using Tables, Dream Report offers the ability to show BAD Quality as either missing data, or can use either the First or the Last value to fill in a range. It also appropriately annotates the range with filled data and can highlight missing data with N/A or other as you specify. Filling in ranges will provide the user with meaningful Footer Summaries, even in the event of BAD data.
This template also highlights that Dream Report is very smart about being able to select data for use in Statistics, for example, selecting the proper sample for an 8:00 am reading, even if the timestamp isn’t exactly correct.
 Universal Water and Waste Water Template 3 – Excel Mapping
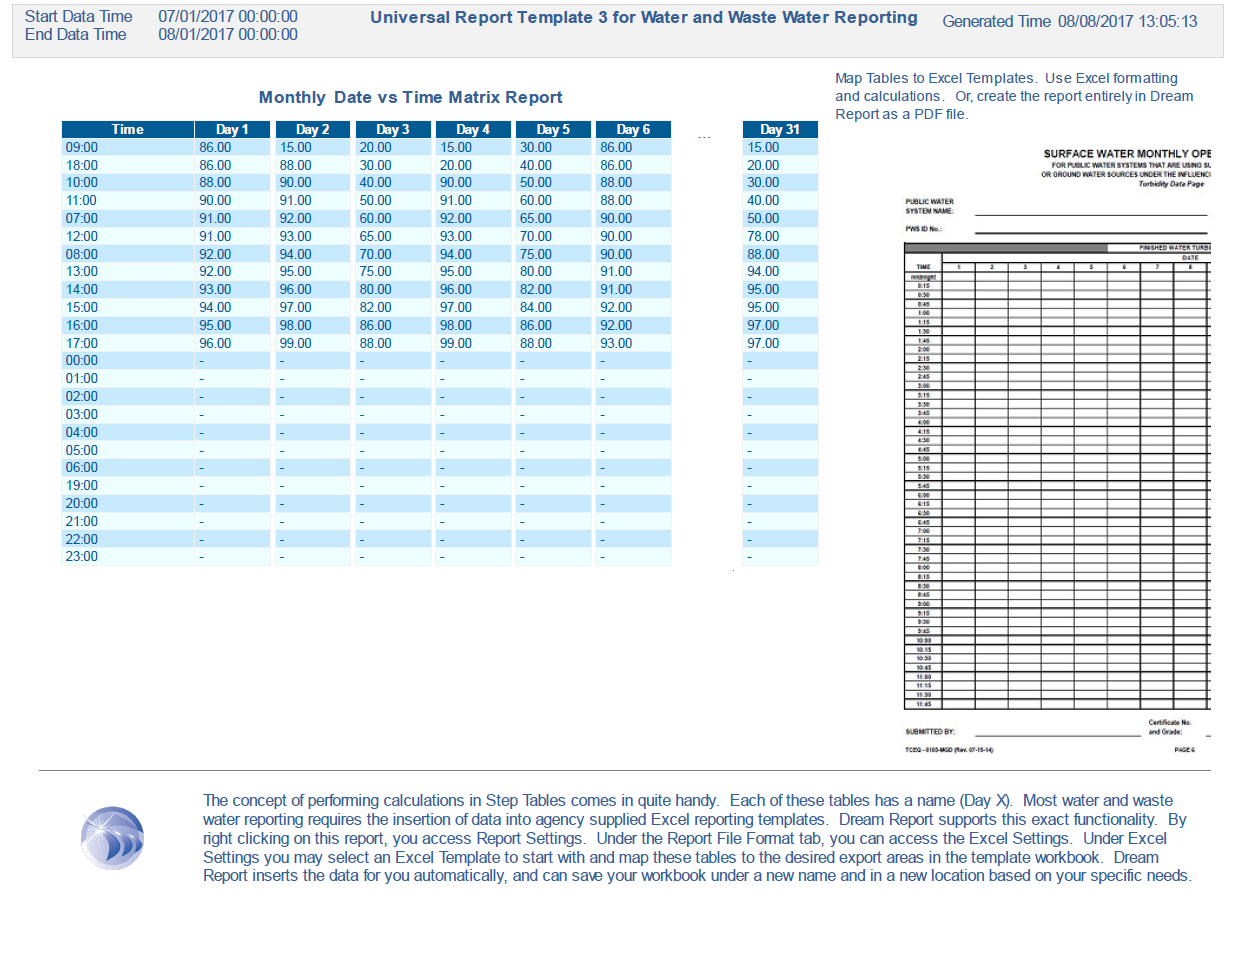
Universal Template 3 shows the Dream Report ability to perform calculations and then map those results to an Excel Workbook. Dream Report can automatically create a new workbook or it can fill in an existing workbook that has been defined as a source template. This is a very common Water and Waste Water requirement where a State DMR, DNR, EPA, etc. agency has defined specific Excel forms and expects its users to fill them in and submit them for Compliance purposes.
Dream Report can map Times, Data Values and Complete Tables into Sheets and Sheet areas of an Excel Workbook. It can even automatically rename your workbook for that Month and Year and distribute that workbook by Email and FTP.
For National Pollutant Discharge Elimination System (NPDES) Reporting, Dream Report can also automatically generate the CSV files that are needed for data uploads to the US Government EPA Systems.
 Universal Water and Waste Water Template 4 – Manual Data
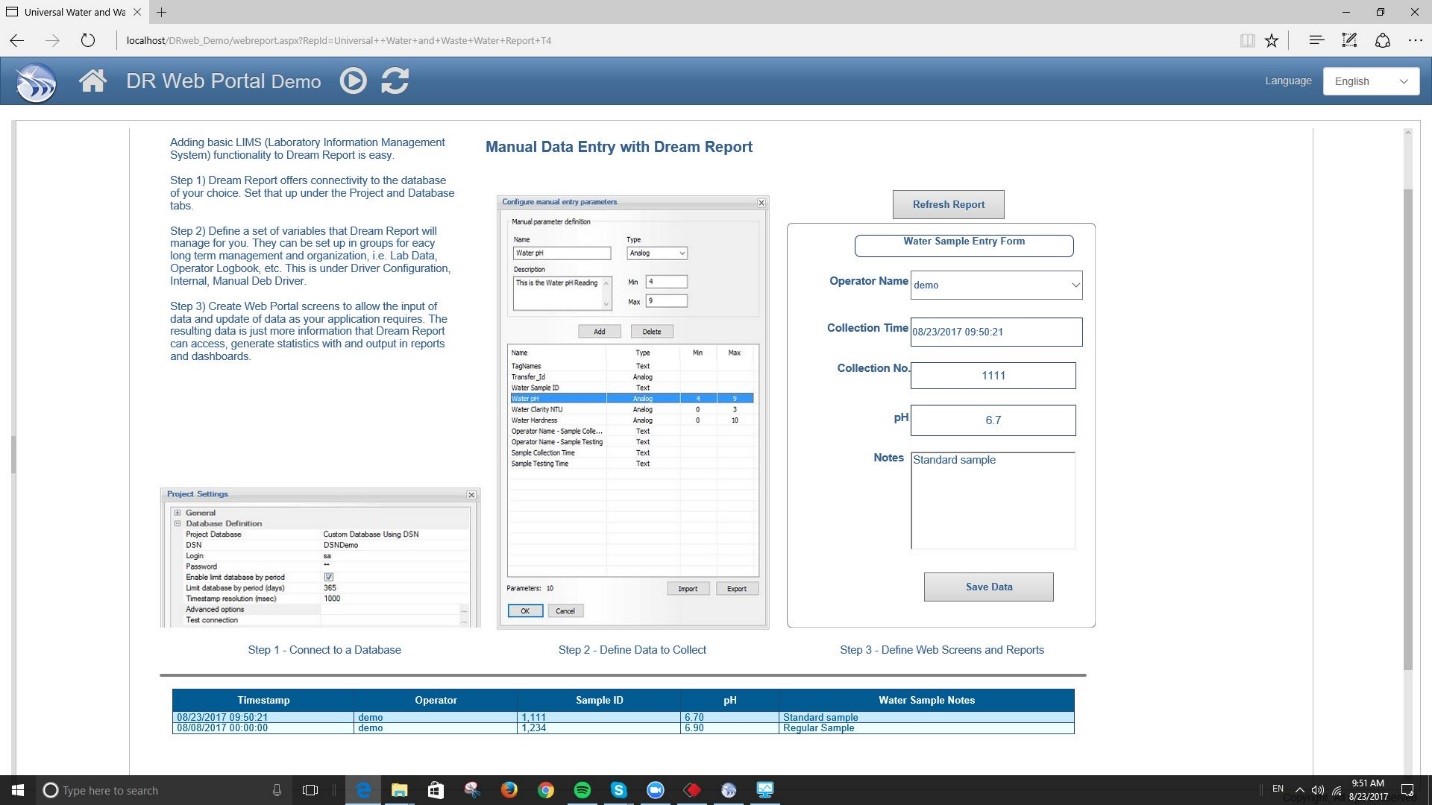
Universal Template 4 introduces the ability to create and interactive Browser Based Portal interface that can be used for report review, and report generation. It can also be used for Manual Data Entry. When performing Manual Data Entry, the user will first set up the Variables that will be required under Driver Configuration with the MDE Driver. These variables will define data types and allowed ranges. Once defined, the user can build interactive screens which are simply a report rendered in the form of an HTML5 format for interactive use in the Browser Based Portal. (Note – Dream Report also supports a Webservice interface enabling other software systems to host and trigger Dream Report content based on URL definitions).
This example shows the basics of LIMS (Laboratory Information Management System), where the user may select their name from a Combo Box, Select the Sample Time from a Date/Time Picker, enter a Sample ID, enter a Lab Test Result (pH) and add notes. Finally, there is a Submit Button that will log this data to the User Selected Database – MDB file, SQL Server, SQL Express, MySQL, Oracle, etc. Once logged, this data may be used for subsequent reporting and analysis throughout Dream Report.
Dream Report Manually Entered Data is indexed by time and variables can be queried and used by any Dream Report Statistic or Object. The Manual Data Management also supports Corrections to data and the Validation of data by a supervisor. Statistics may use results as All Samples, Not Validated Samples and Validated Samples, for reports and dashboards.
These features enable Dream Report to deliver very nice Laboratory Information Management System (LIMS) functionality.
 Change Request Form – Letting Users Request Enhancements
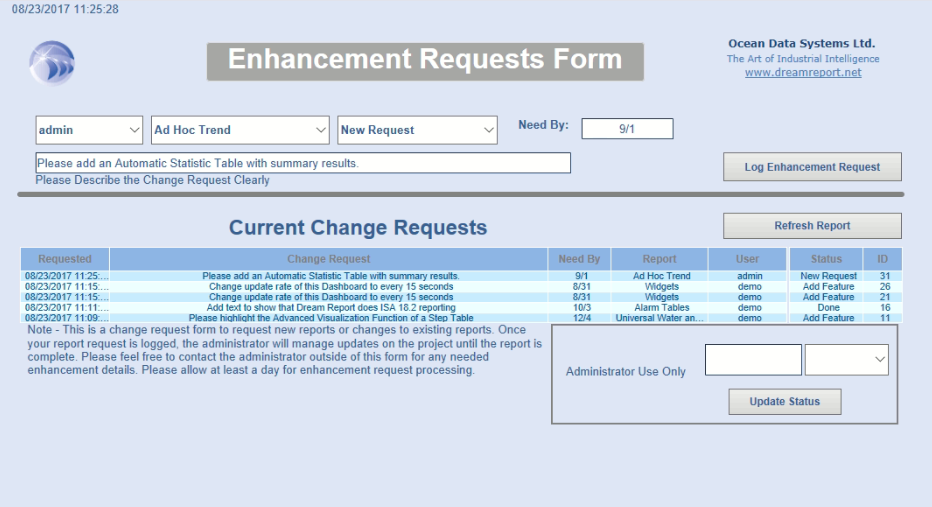
Some Dream Report Demonstration Reports can be used in applications with very little change. The Enhancement Requests Form is an example of that. This interactive Web Form enables users to make enhancement requests to reports. This is often used in cases where specific users are defined as Report Administrators and others need to make requests for enhancements.
This form demonstrates data entry fields for User, Report Name, Type of Request, Date Needed, and a Note. Users then will press the Log Enhancement Request button to save the data. The Report Administrator can update the status of requests to Done (or any other text or combo box selection). It is common for users to split this report into two forms, one for end user use and another for Administrator use.
 Interactive Trend Report – A Self Service Data Portal – With Export
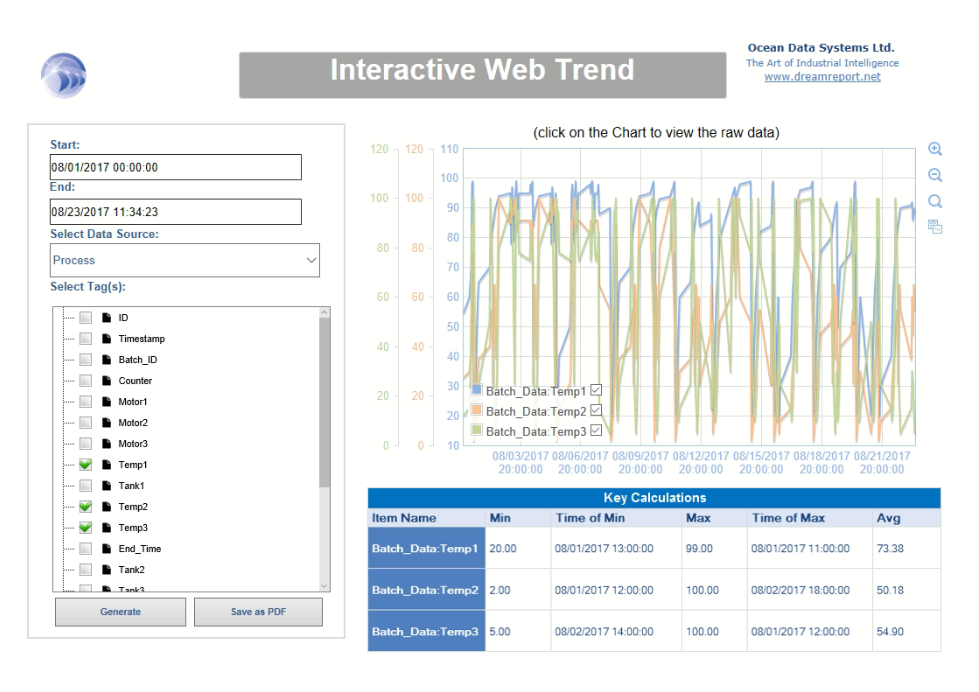
Every Dream Report installation should offer their users one or more interfaces for data access and troubleshooting. Dream Report offers extensive functionality for the selection of data Sources and Tags, filtered by various Data Models that are user specified and even unique to specific users or displays.
The basic features of Dream Report to select Dates/Times, Batch Numbers, Events, Data Sources and Tags, lets users build very tailored interfaces for analyzing any of the data in a system. These are simply built once and then assigned to users in the Security Model for use when they Log into their Dream Report Portal Browser Session. Users can benefit from these interfaces as “Self Service” portals.
Ad hoc displays of this type are not just limited to automation data. Dream Report delivers extensive SQL Query functionality with the ability to use Dynamic Parameters (variables in a SQL Query) that are supplied by other Dream Report objects. This opens Dream Report to be a report and dashboard solution for other LIMS systems, Asset Management and Maintenance databases.
Objects in Dream Report can be set to reveal the Raw Data behind their statistics (Raw Data Hyperlinks) and can be set to export data in either Clipboard form or as a CSV file for use in other software or in Microsoft Excel. Reports can also Hyperlink from one to another to enable the creation of Drill-Down links to other reports, with passed parameters for Data Variables, Dates/Times, Batches, etc.
Summary
These are just a few of the resources available to assist you with accelerated learning and application development with Dream Report. Our demo project offers many valuable examples of How-To, to get you up to speed quickly and easily.
Ocean Data Systems and its partners are very happy to engage with you. If you are unsure how to perform a statistic, or not sure if Dream Report will work in your application, feel free to contact our partners or Dream Report directly.
Dream Report Support can be reached at Support@DreamReport.net
Please also know that we have extensive video resources available on our YouTube channel.
https://www.youtube.com/user/OceanDataSystems/videos
Download the Dream Report FREE Trial and Generate Reports and Dashboards on your own data.